How to Create Sales Reports Such as Bin Deliveries and Bin Removals
Joshua Angeles
Posted at August 20, 2025 10:08 am. Last updated at August 20, 2025 01:08 pm
Here's how to create sales reports for the services/products.
- Creating Spreadsheets for Sales Report.
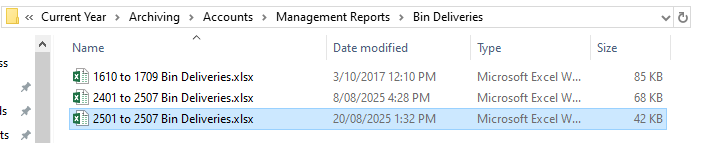
E.g. I'll use Bin Deliveries for this tutorial- Find a copy of the .xlsx file of Bin Deliveries. "XXXX to XXXX Bin Deliveries.xlsx"
- Go to Z:\Australian Waste Management\Current Year\Archiving\Accounts\Management Reports\Bin Deliveries for the xlsx file.
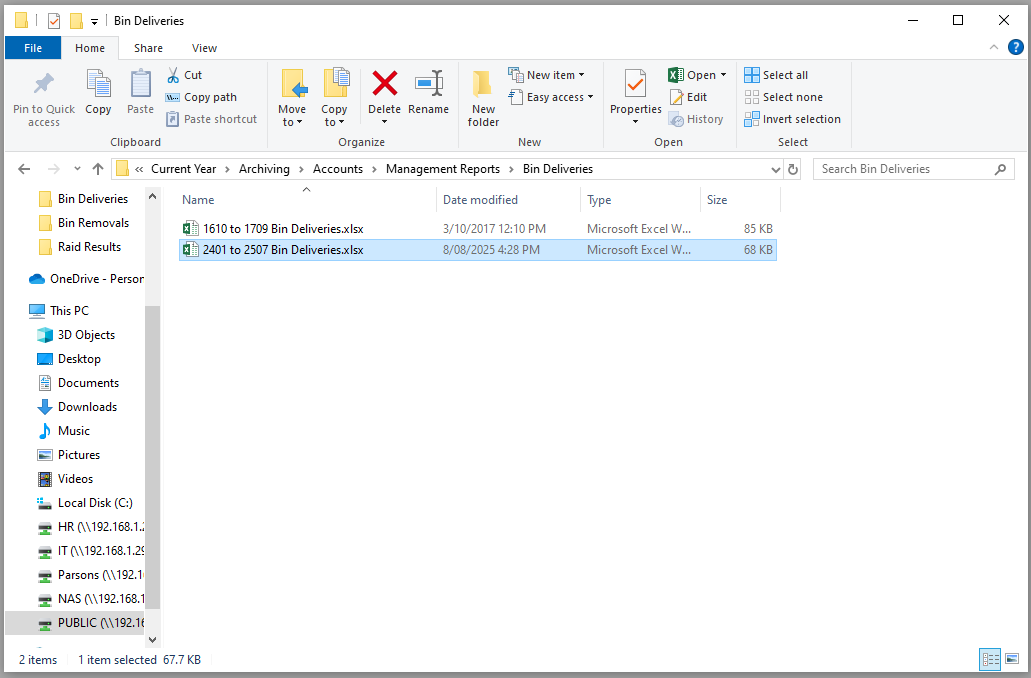
- "2401 to 2507 Bin Deliveries.xlsx" the first set of numbers is the start date (January 2024) and the second set is the end date (July 2025).
Start date depends on what you're looking for, safe bet is the start of the current year or the previous year. End date would be better if the previous month of your current date. Unless there is a requested start and end date.
- Copy the file and rename with current date (YYMM). Open the files to check the content. So your new file would be something like: "2501 to 2601 Bin Deliveries.xlsx" - January 2025 to January 2026 Bin Deliveries.
- Bin Deliveries.xlsx is the sales report of the bin deliveries. Two (2) sheets: One for the Graphs and Tables, the other for the Raw Data we will be using.
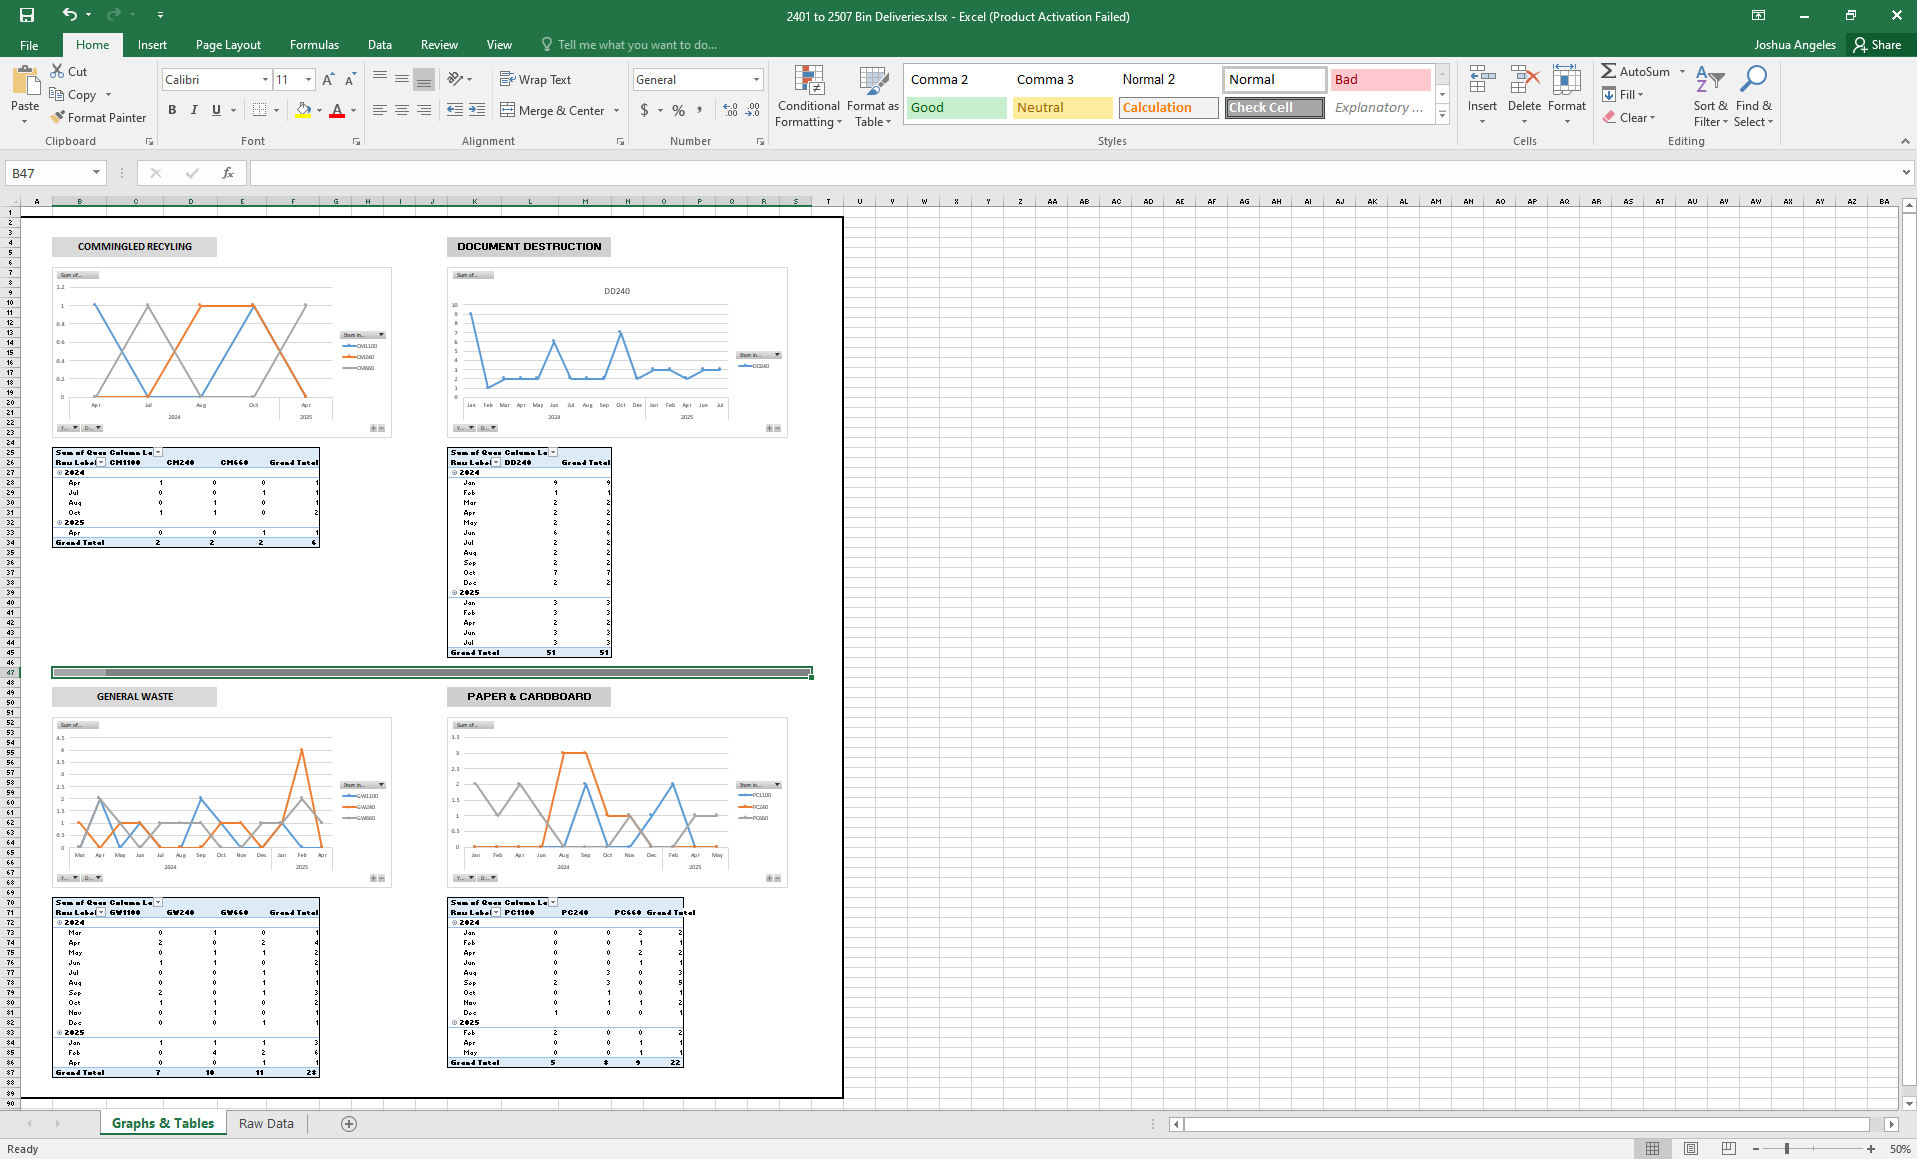
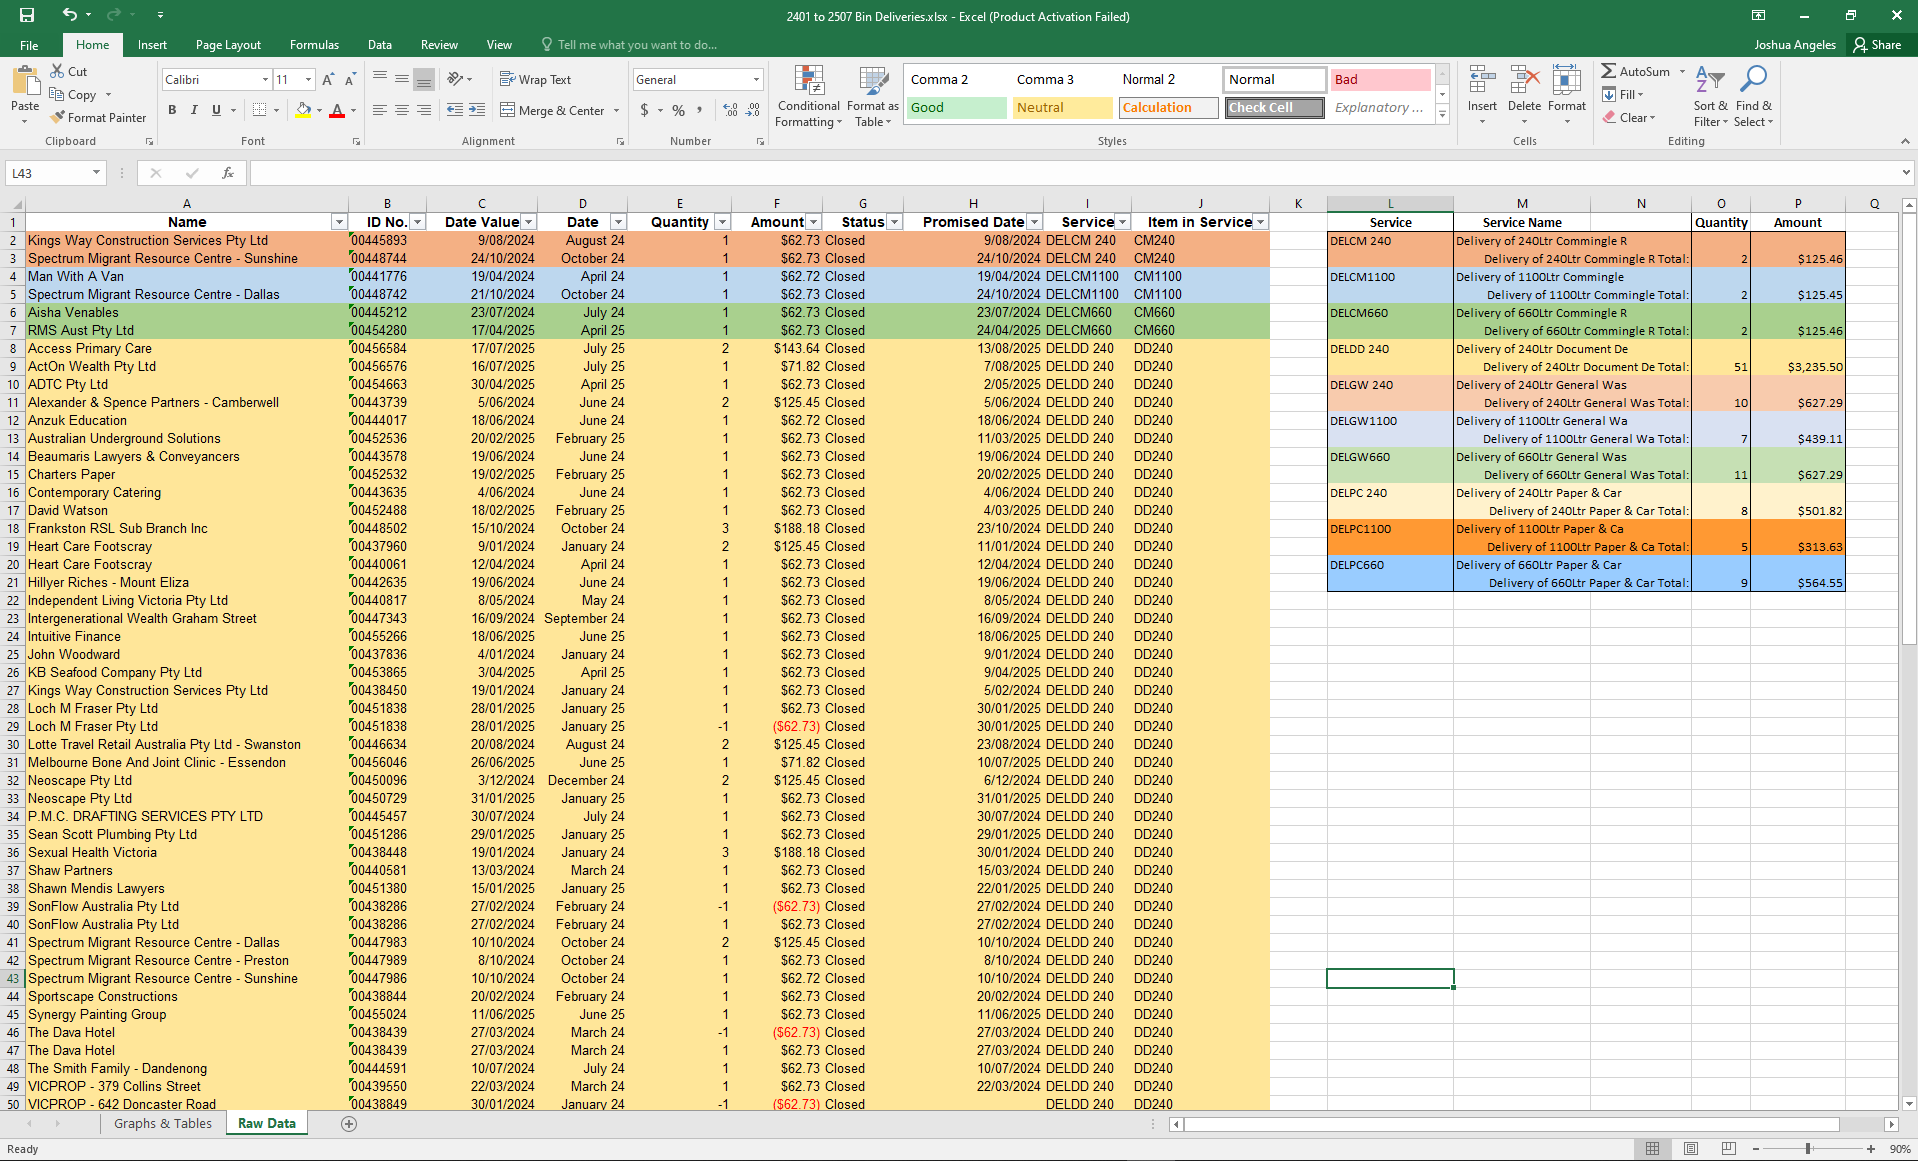
- Let's start with Raw Data. We need to update the data.
- Launch and login to MYOB.
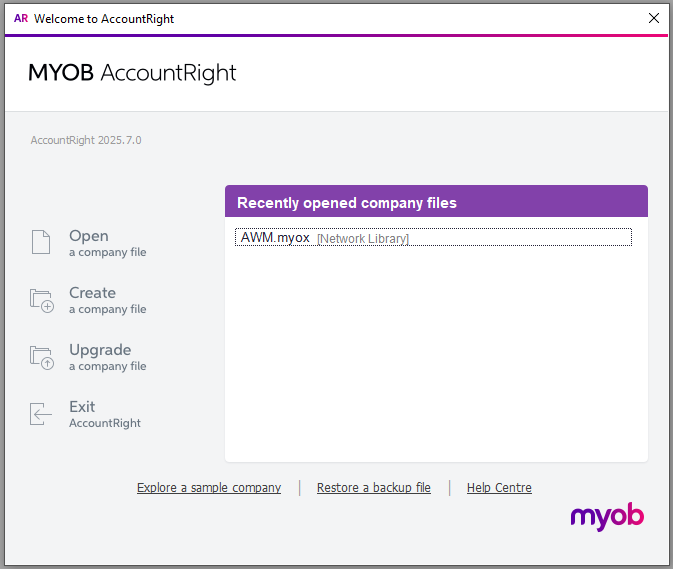
- Go to Reports and go to Sales tab.
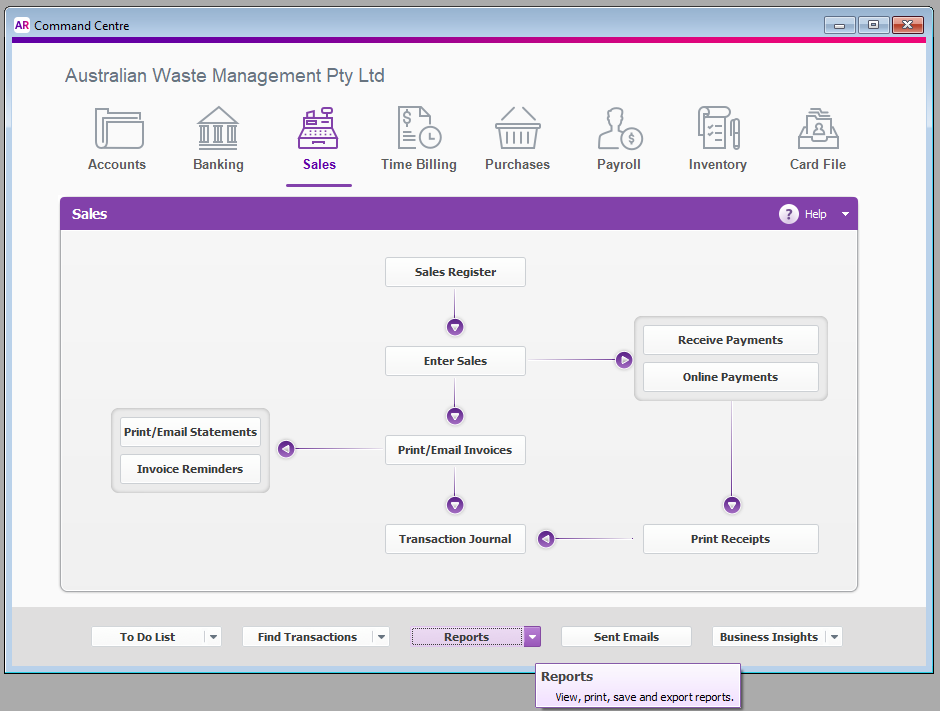
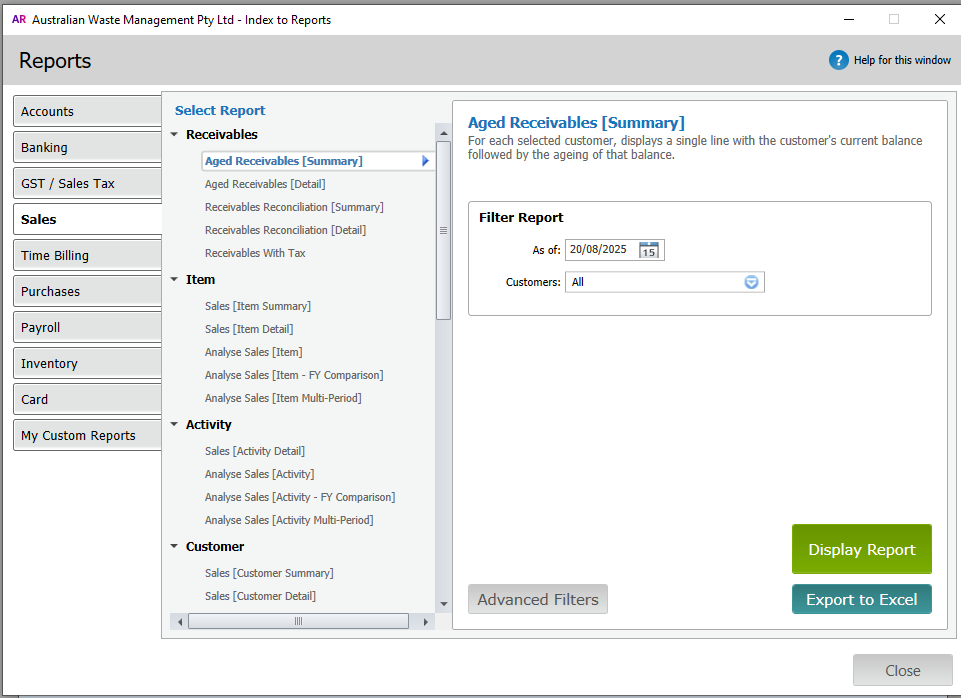
- Click Sales [Item Detail]. Input the start and end date. In this example, I'll be using January 01, 2025 to July 31, 2025 for this tutorial. Click Display Report after.
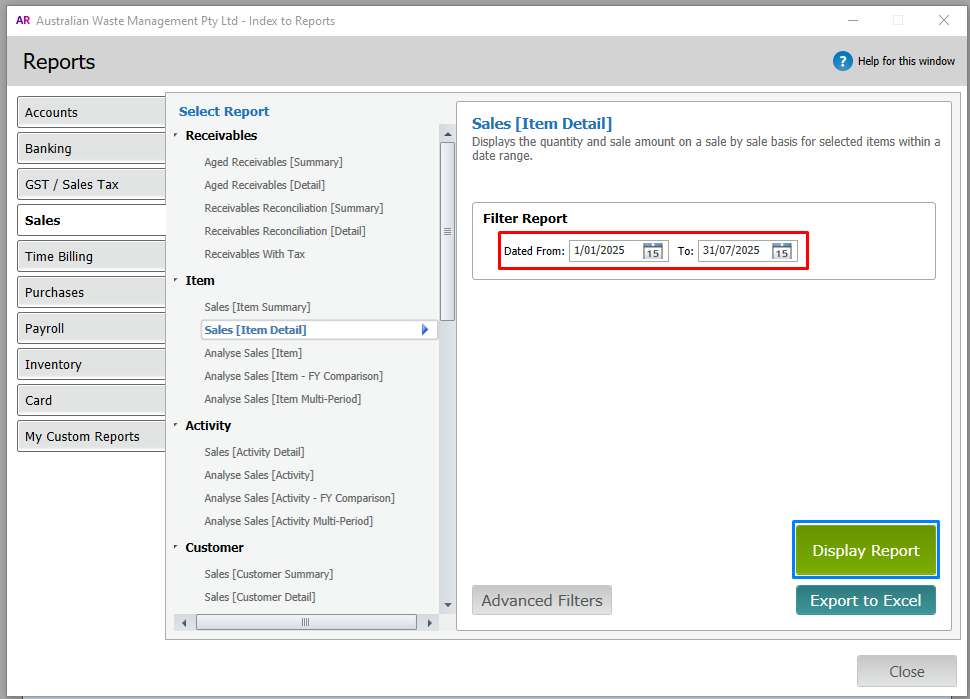
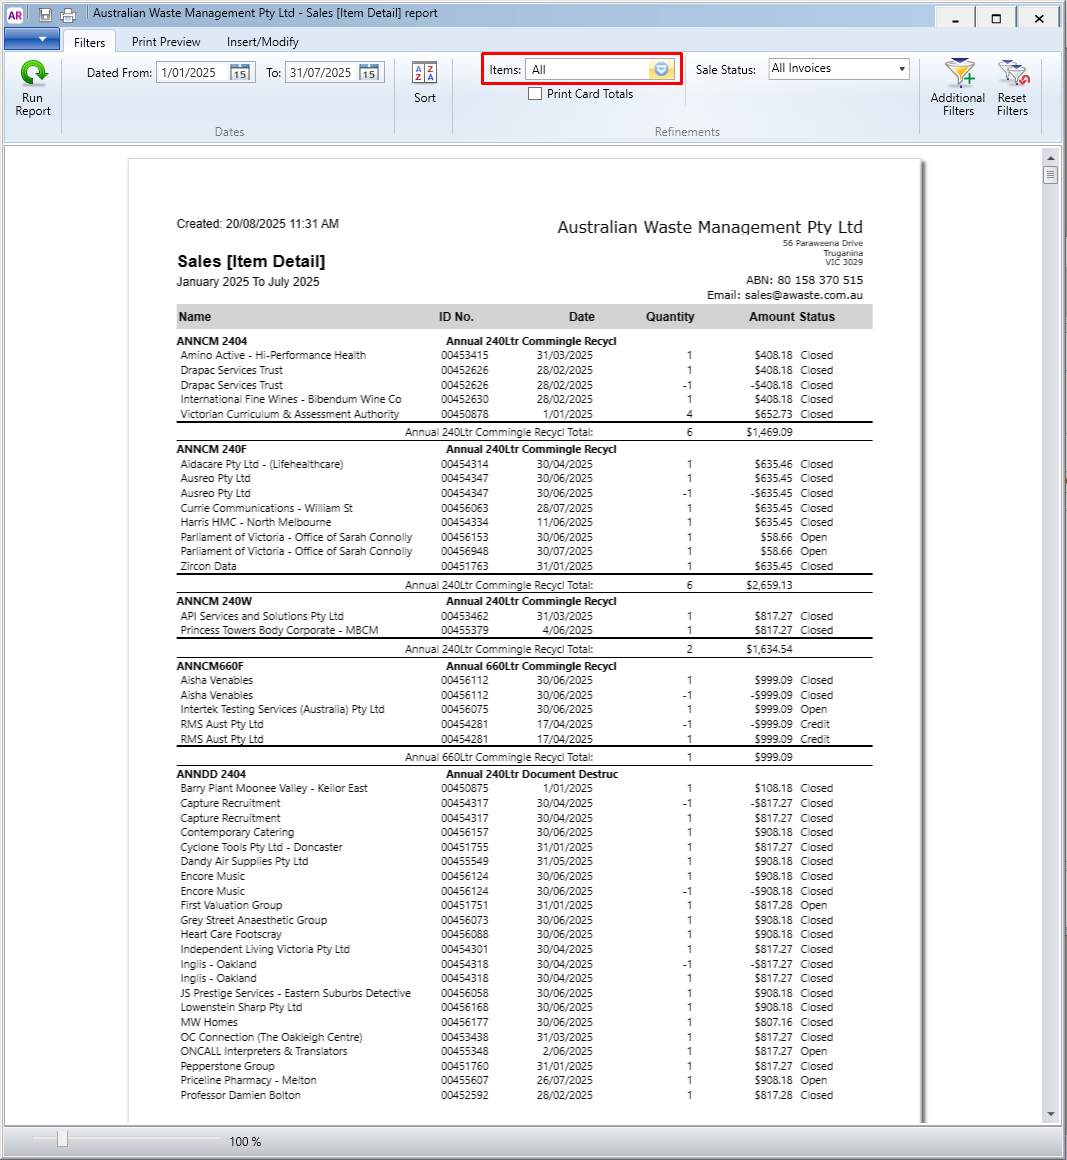
- The sales report will open. Let it finish generating the pages. Once it is finished generating, click the selection box on the right of Items:
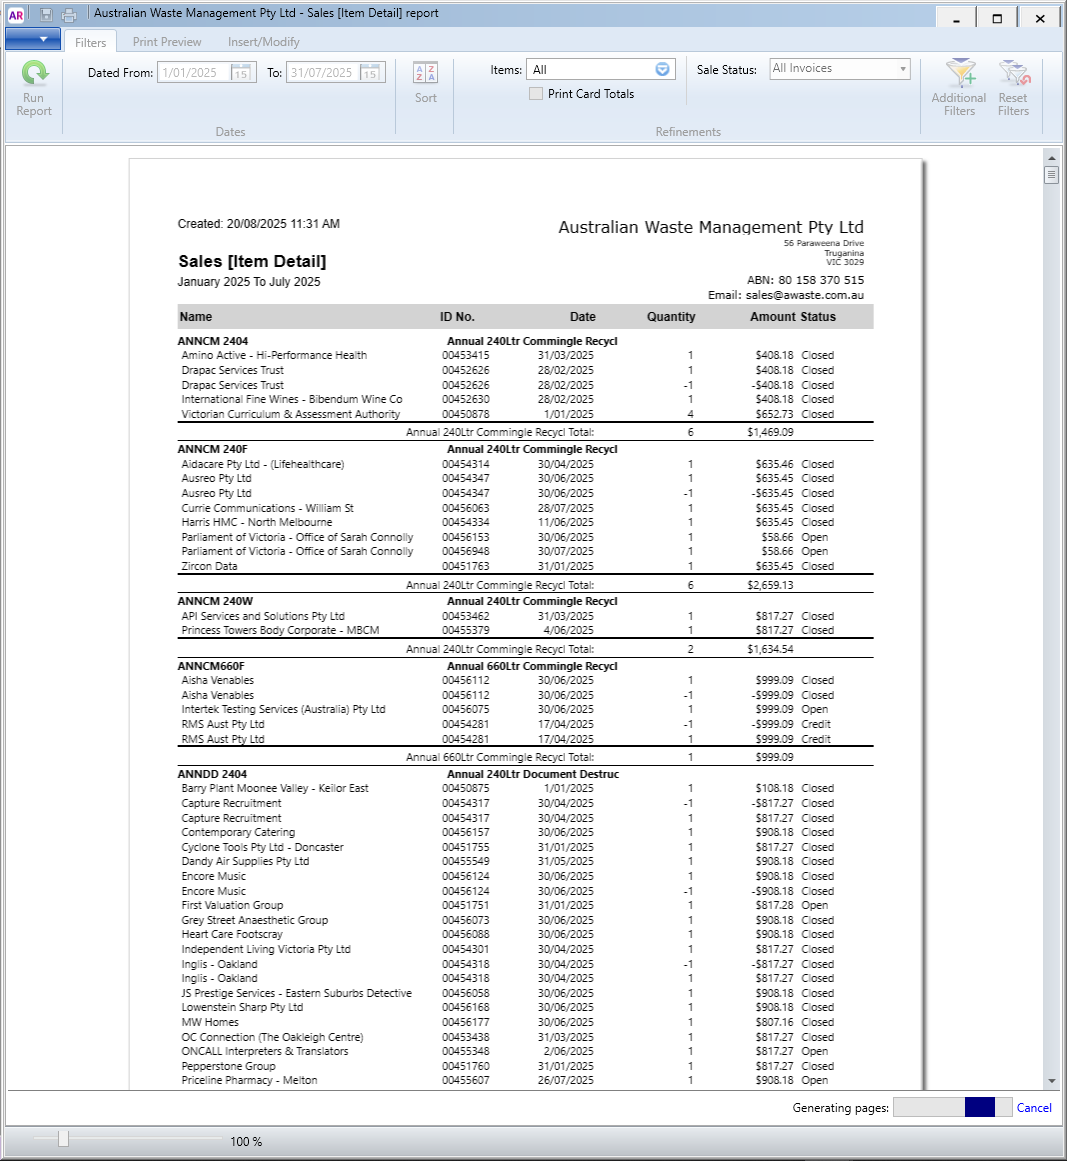
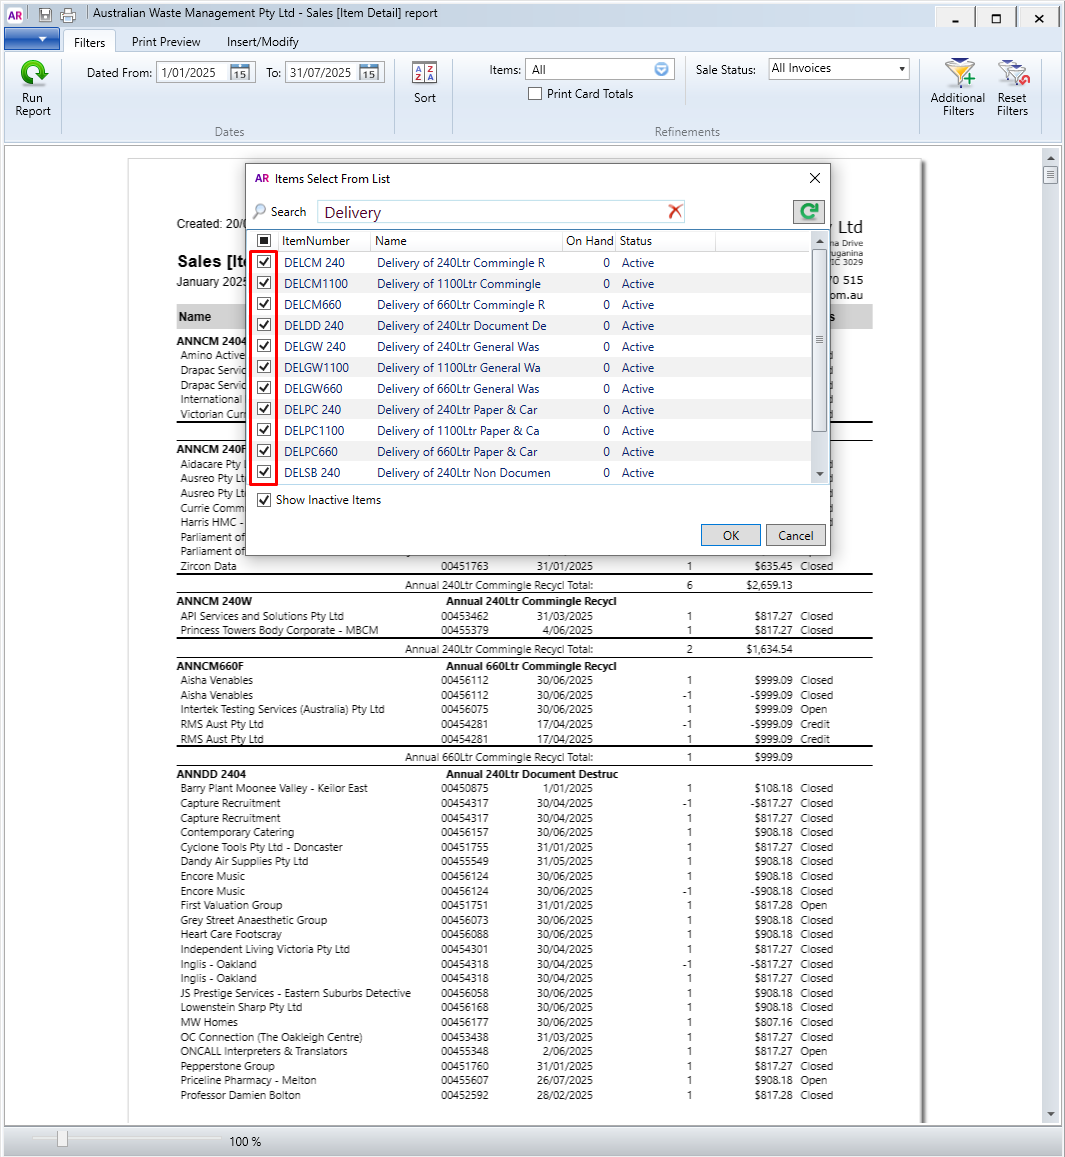
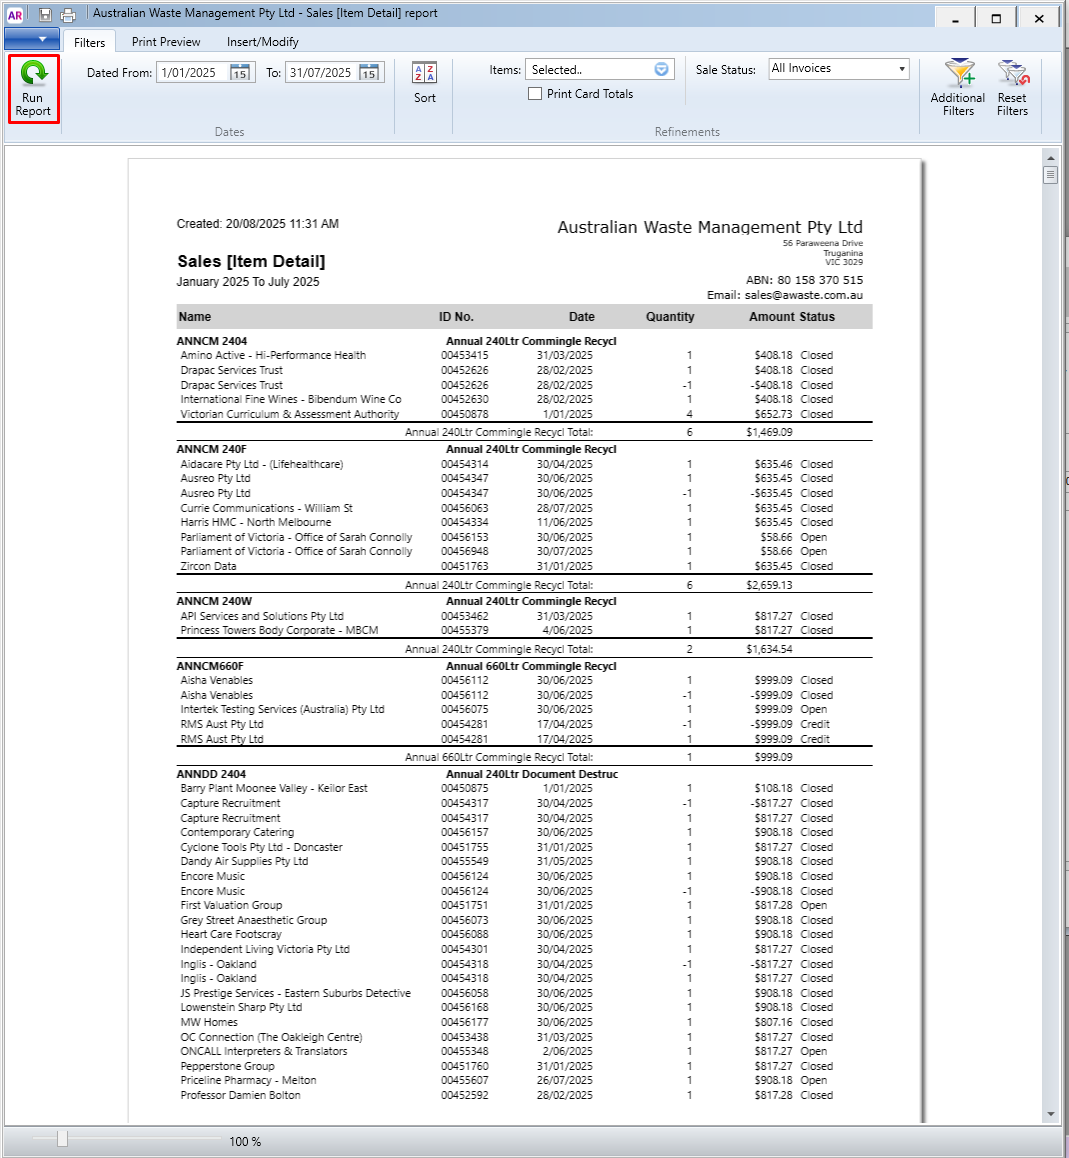
- A window will appear after to select which items would be displayed. As I am doing a tutorial for Bin Deliveries, I'll input "Delivery" in the search box and check the boxes for the items that fall under Bin Deliveries. Click Ok after. Click Run Report to regenerate the sales report with only the items we are looking for.
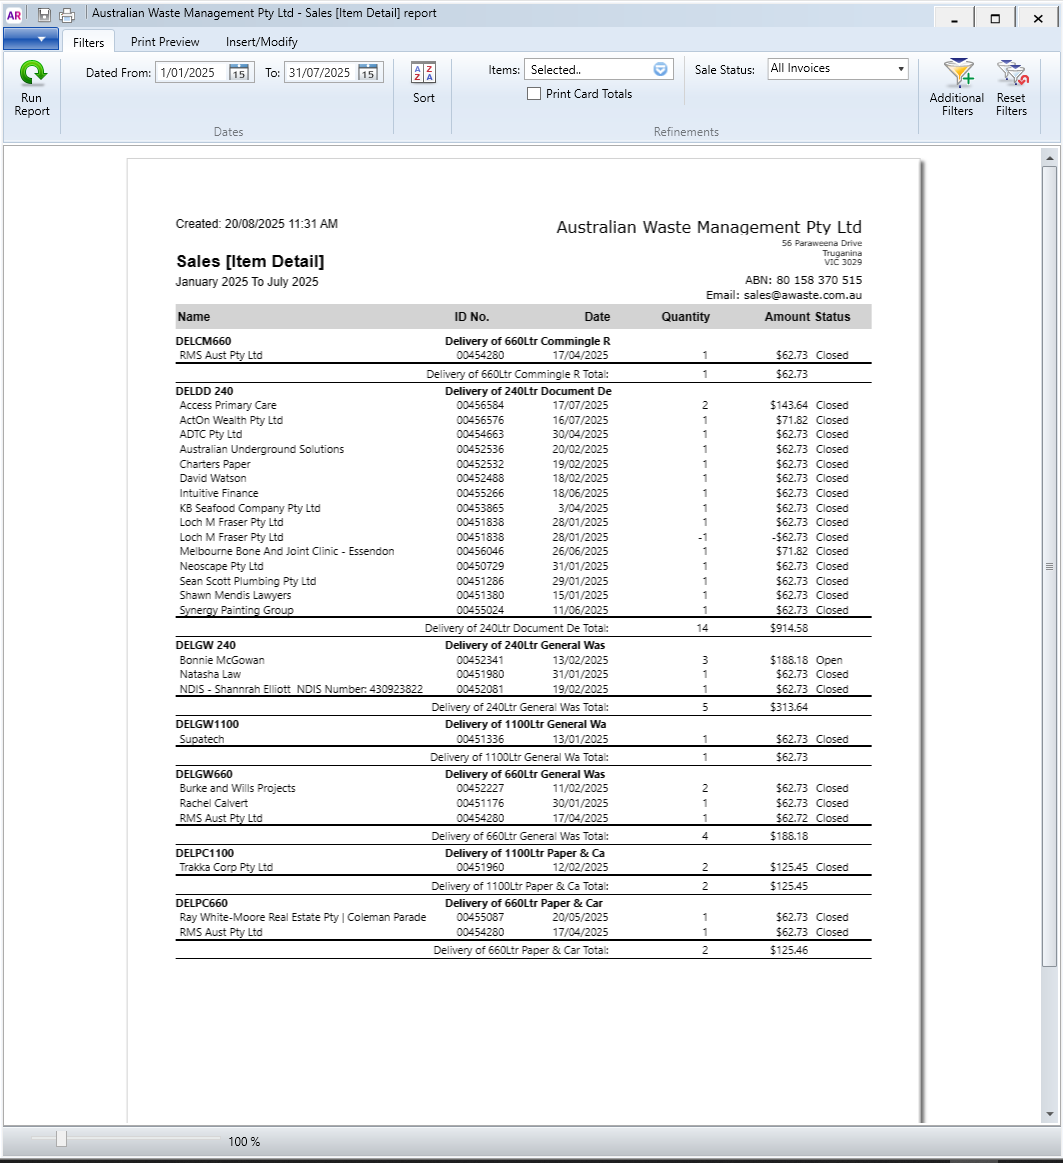
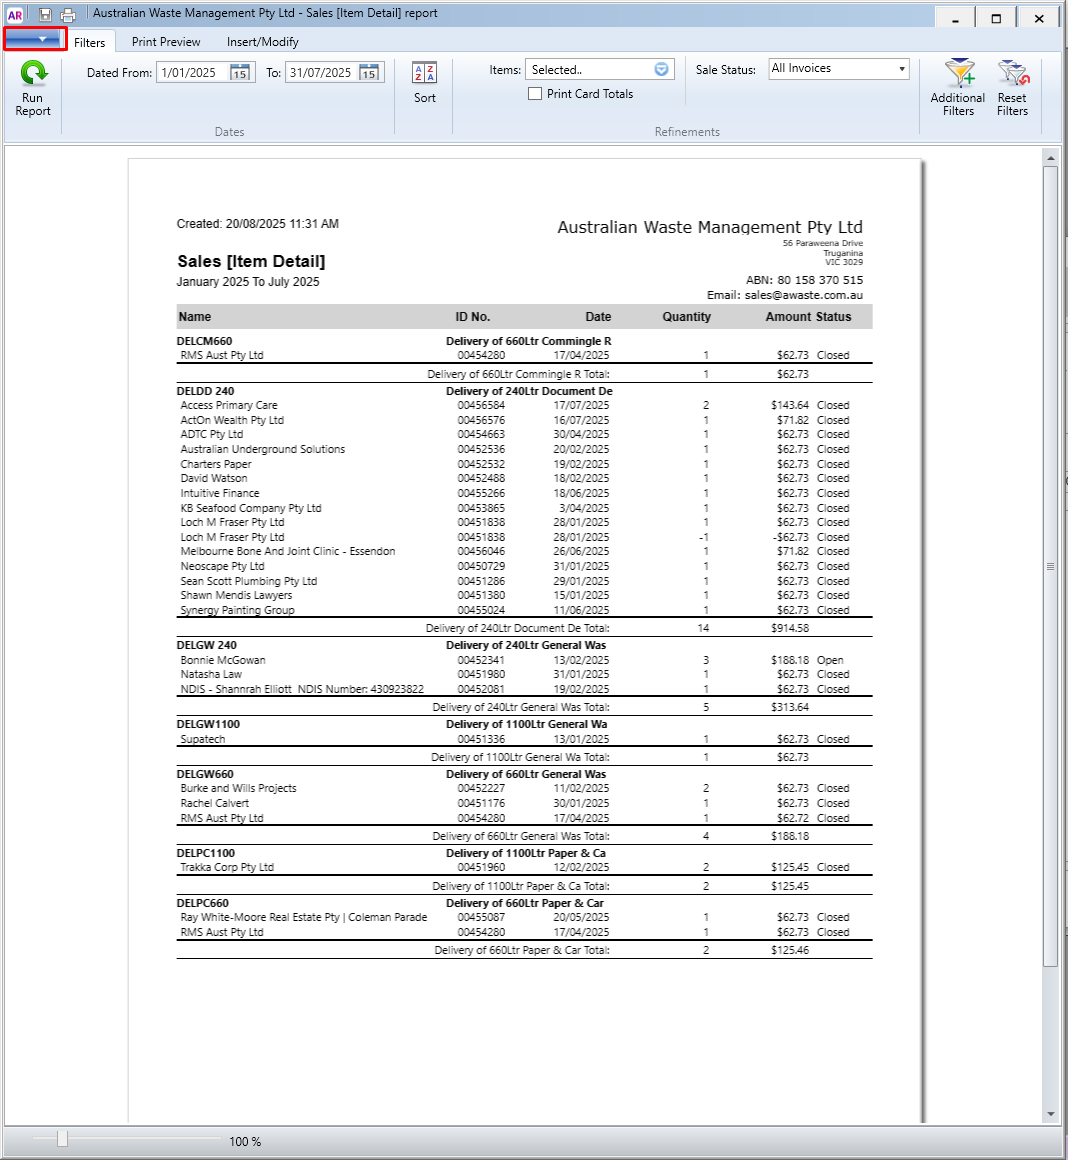
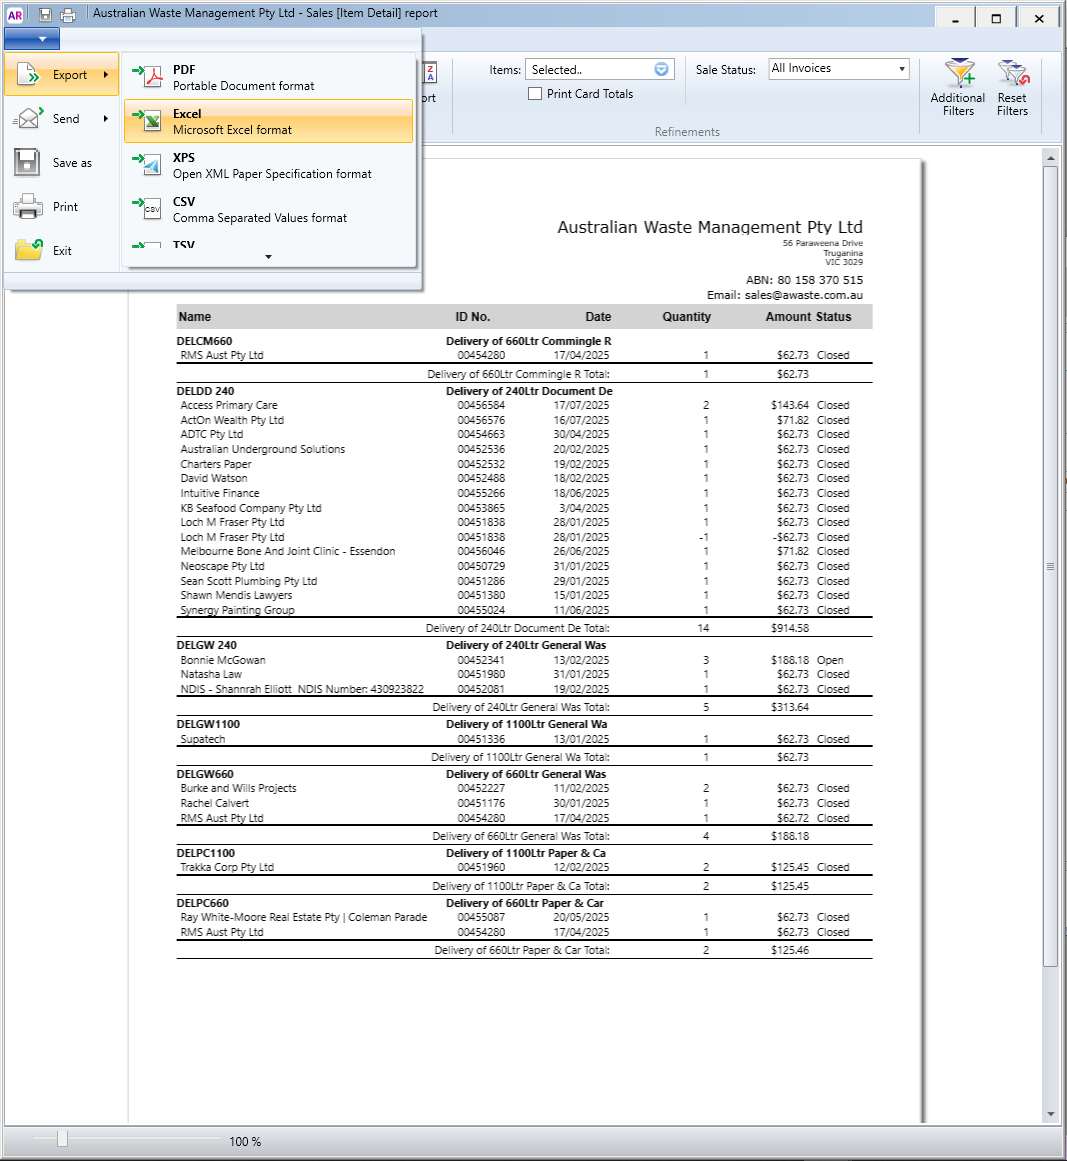
- Time to export the sales report. On the upper left, click on the drop down list. Select Export and Excel. Wait for a few, then an excel file will open.
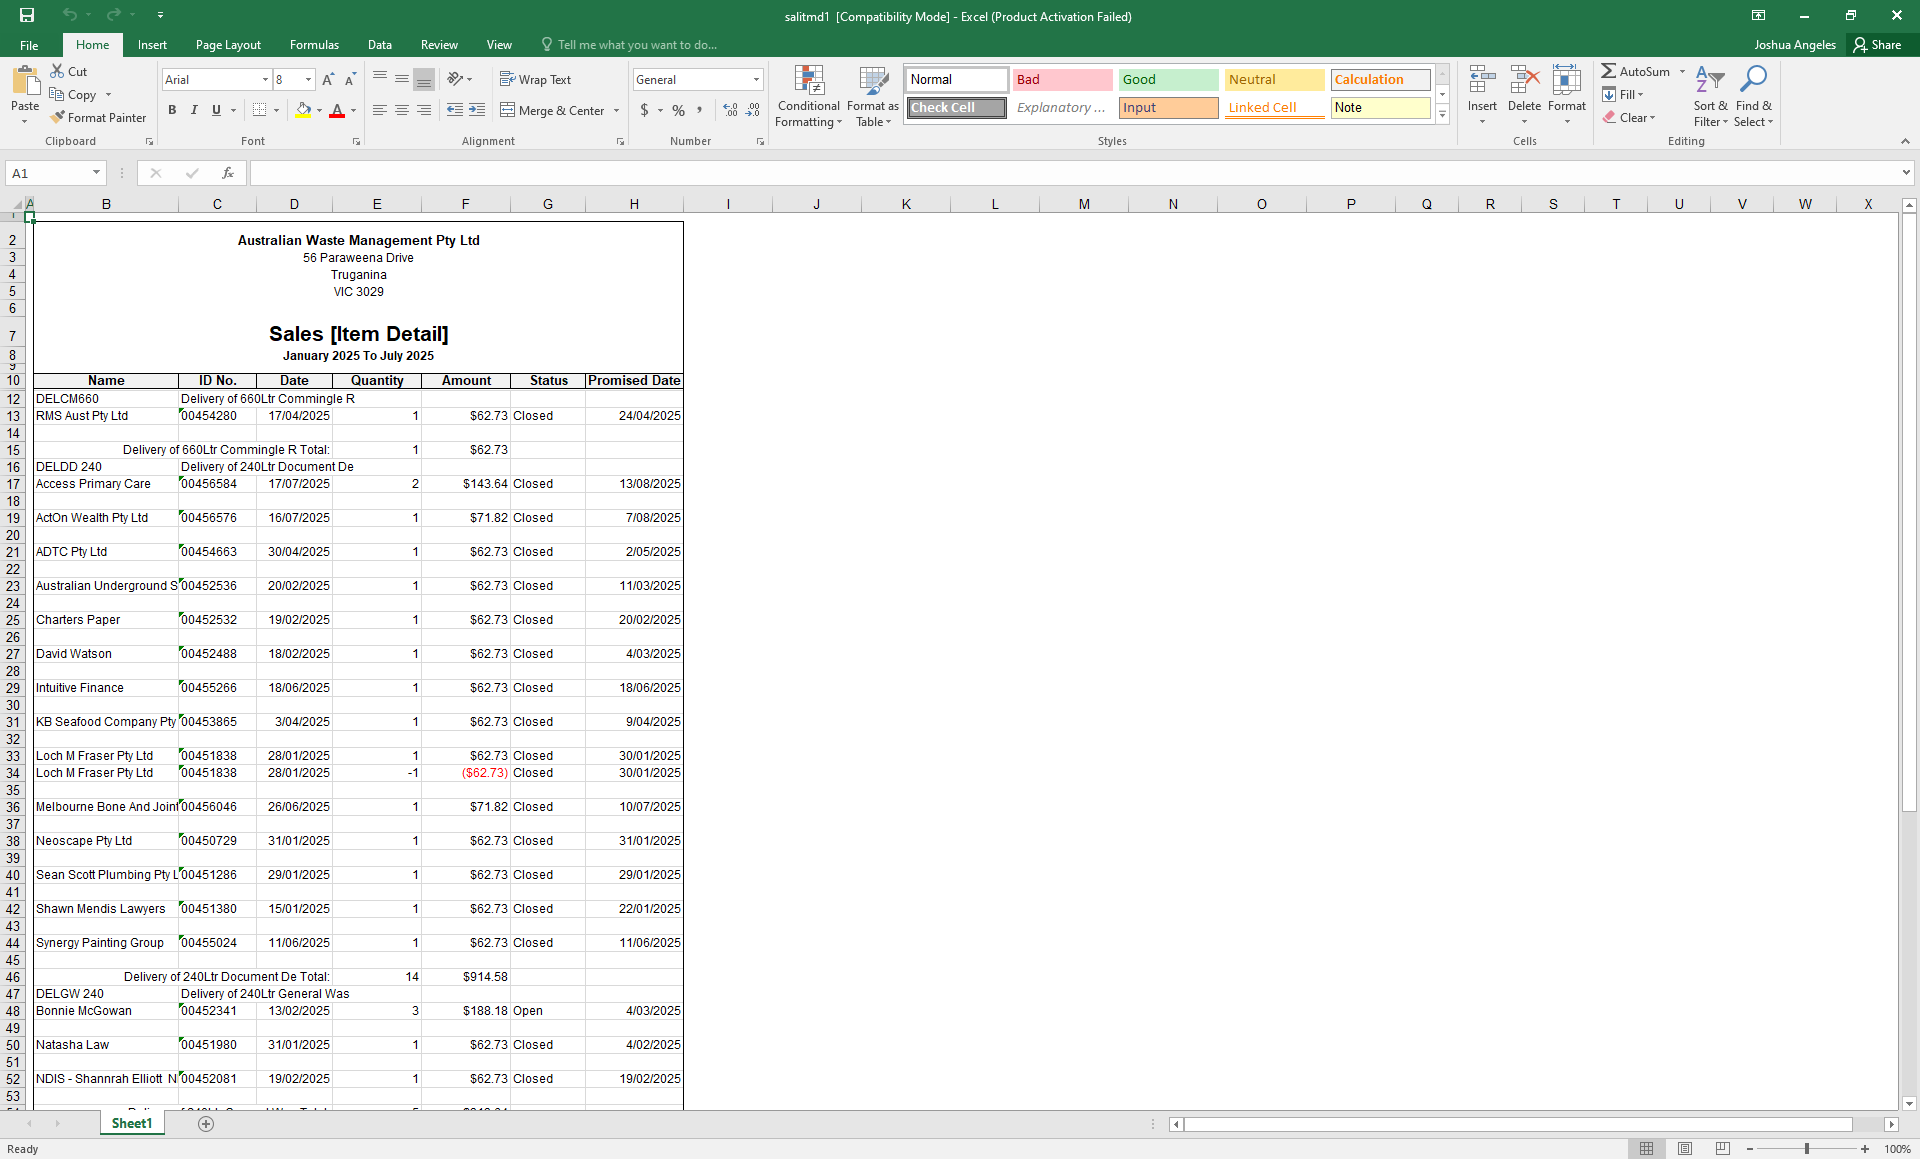
- This is the sales report for Bin Deliveries from MYOB. We will use the date here and input to our file.
- Launch and login to MYOB.
- Now we have the data, back to the Bin Deliveries file.
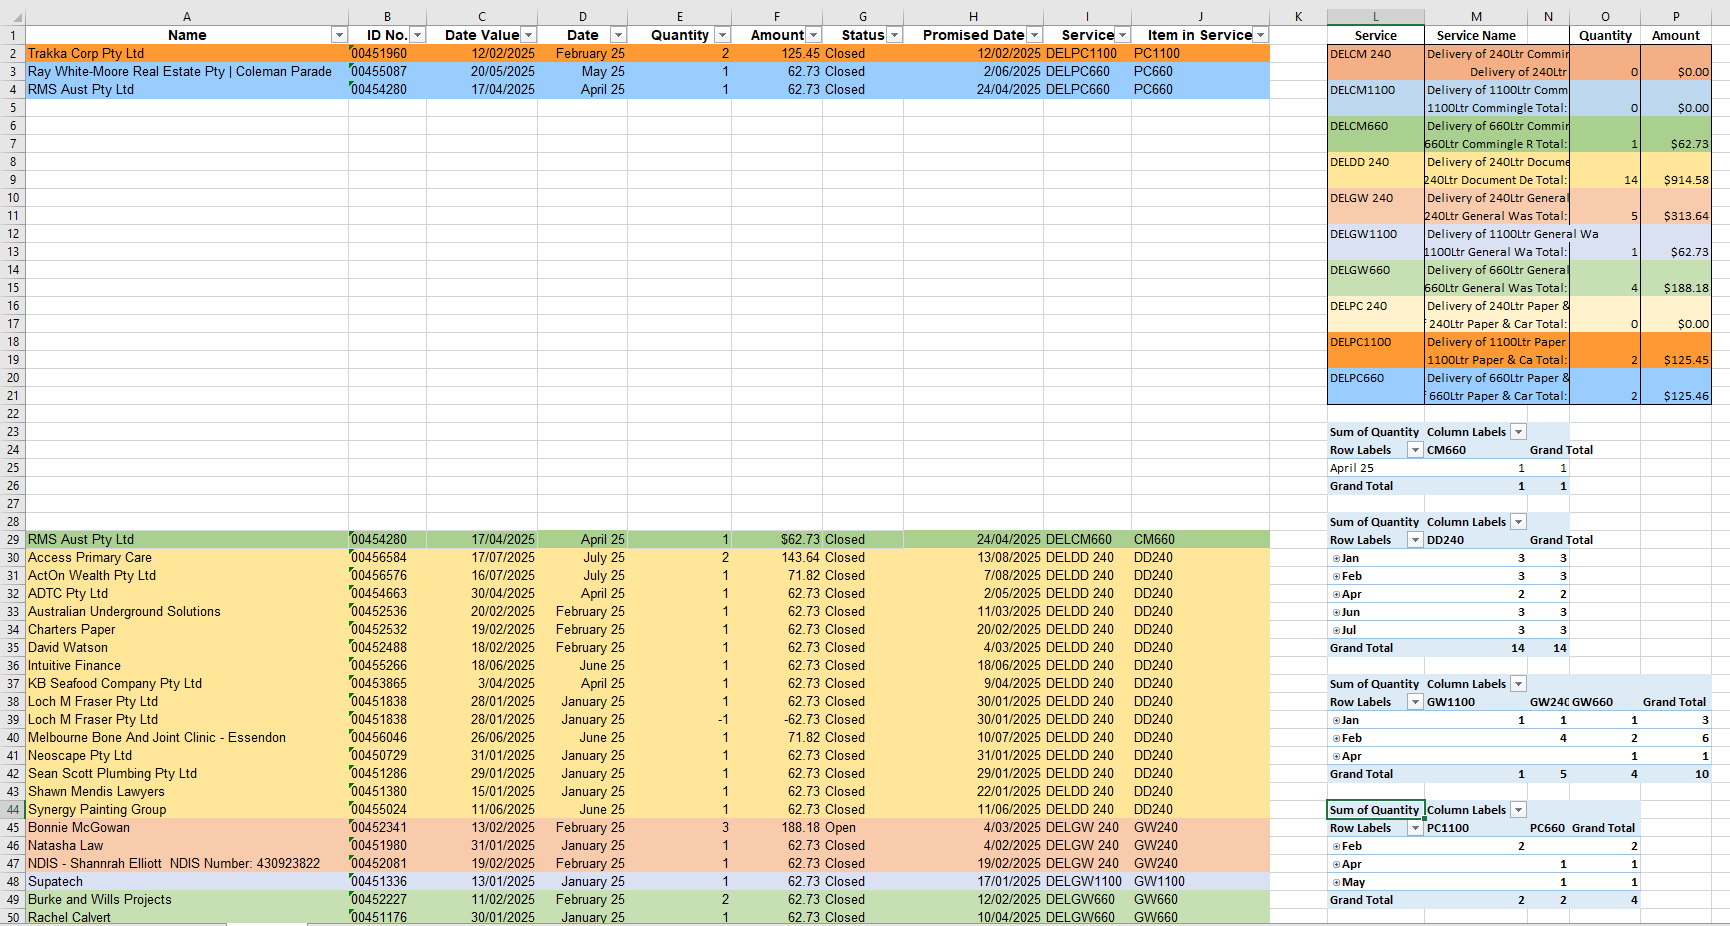
- I color coded each service for clarity so you can follow that or create your own. Also, the Date column has a code to simplify the date from the report into a simpler version.
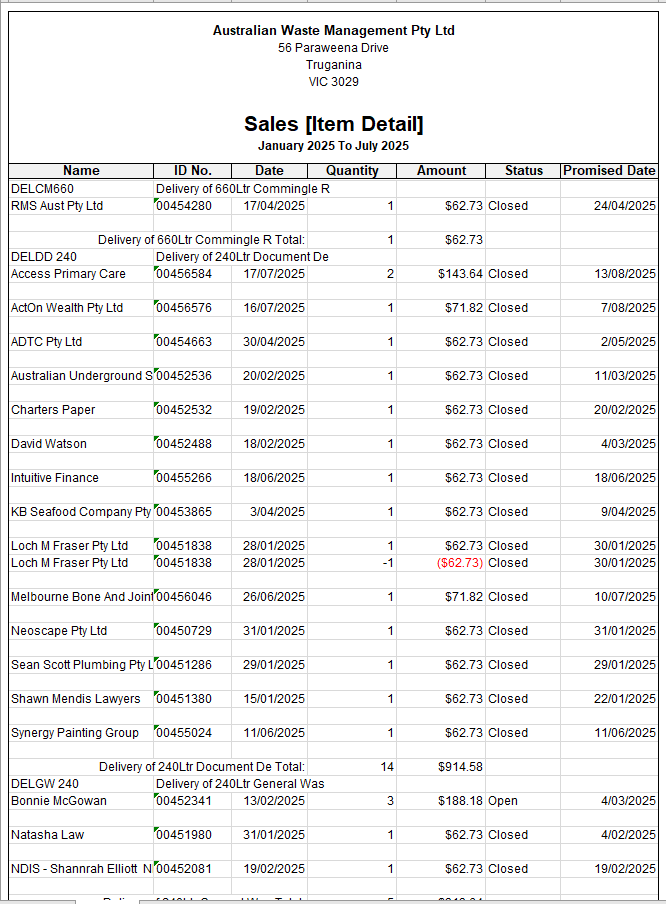
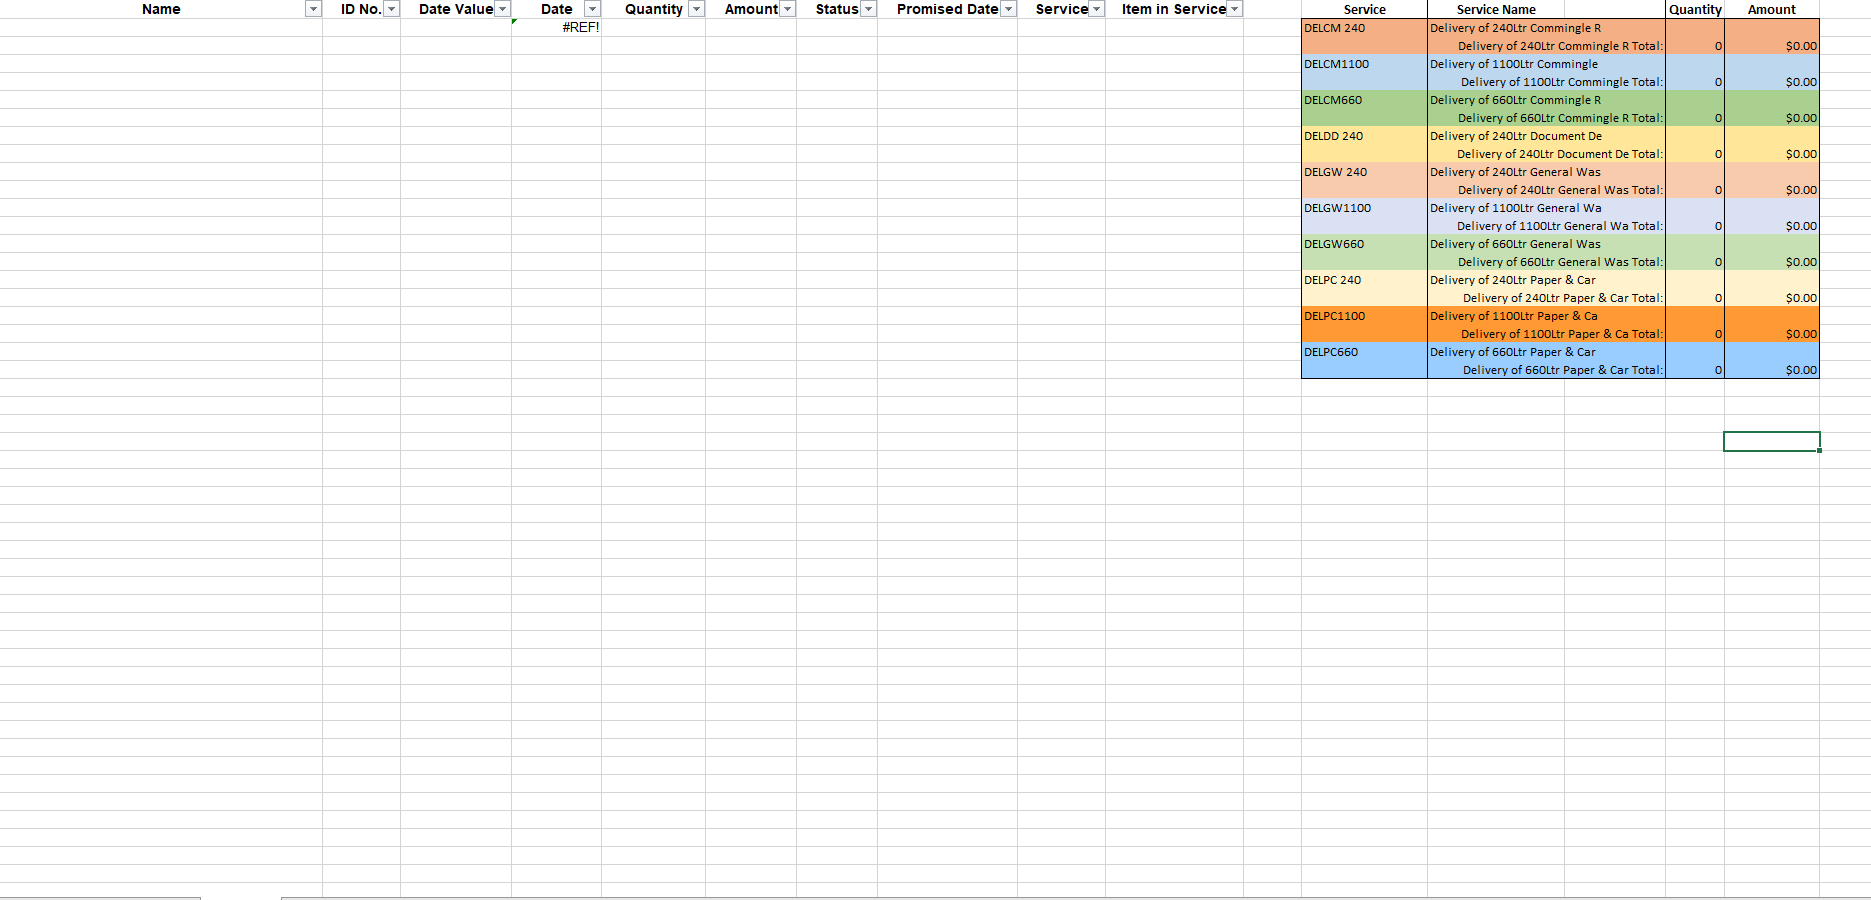
- Start copying and pasting from the sales report to your xlsx file. Copy the data from all columns of the sales report, be mindful that the Date column of your file that it isn't changed.
Check the cell of the Date column. It should have "=DATEVALUE(C2)" to convert the date into a simpler format. Update the table on the right with the quantity of the service and amount.
Do the same with the other services that the sales report from MYOB has exported.
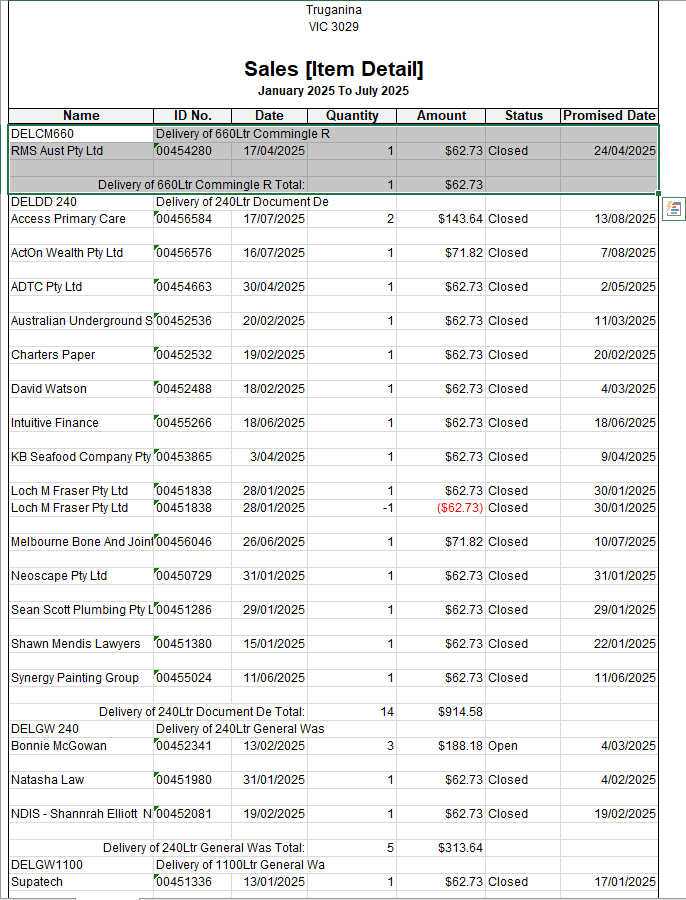
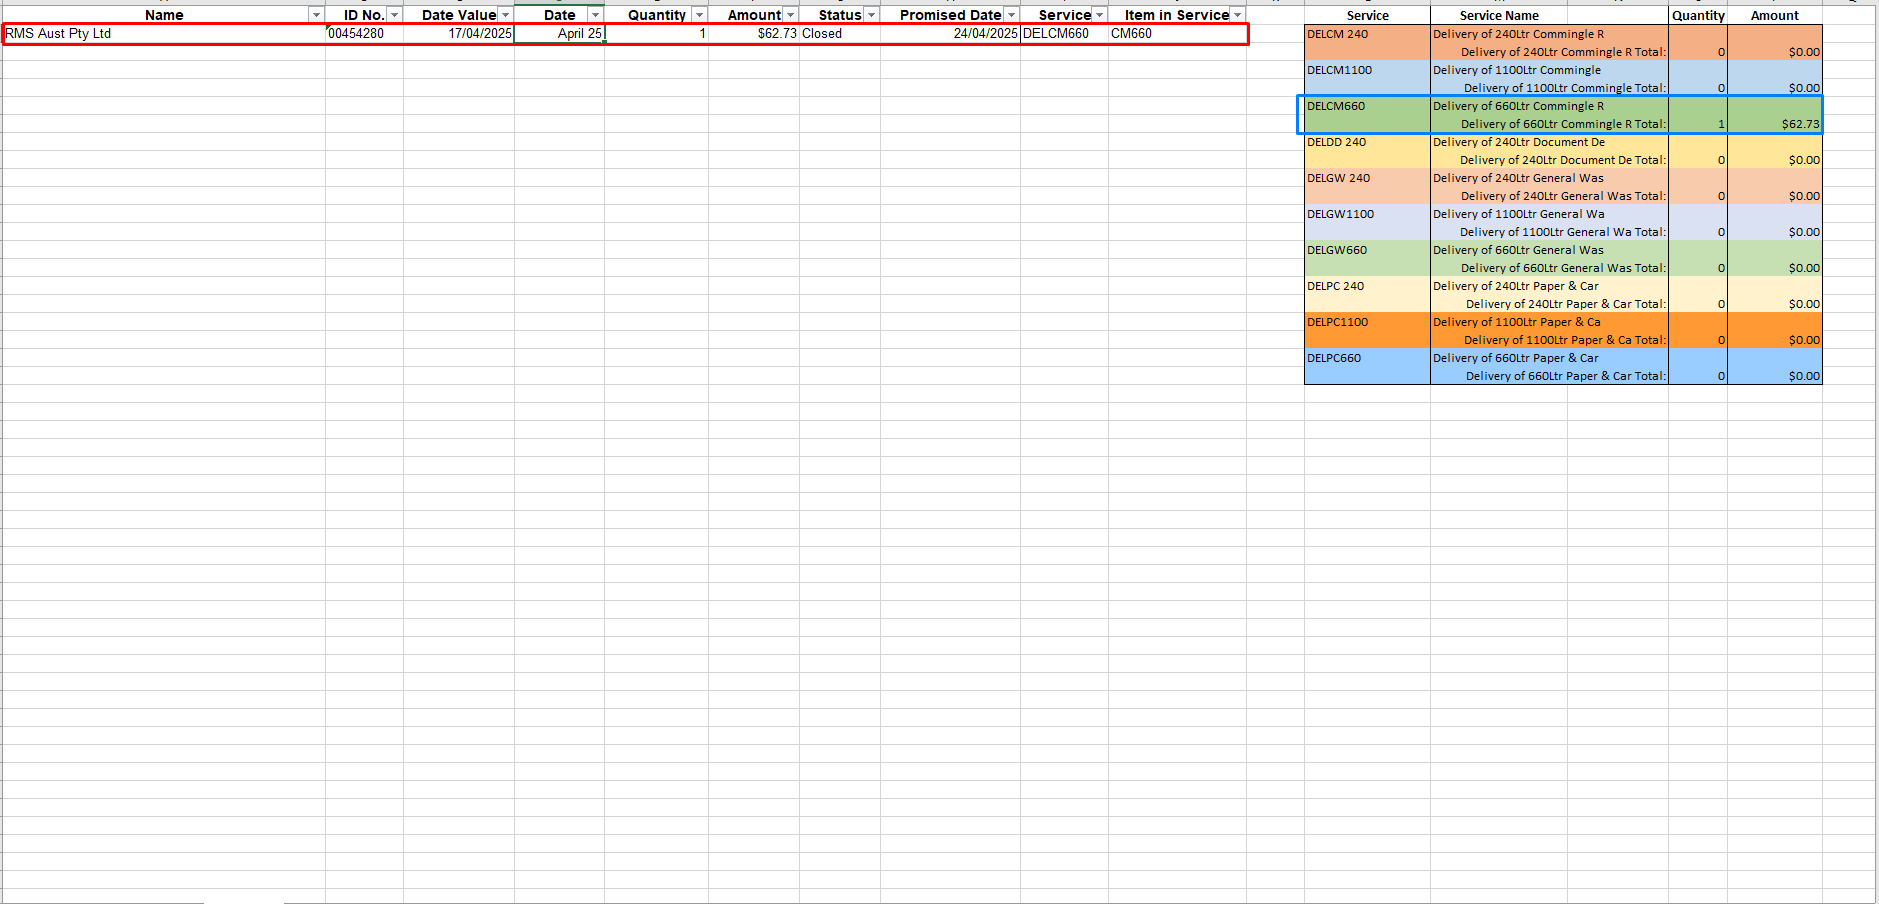
- Once, you are finished encoding the data, double check the content.
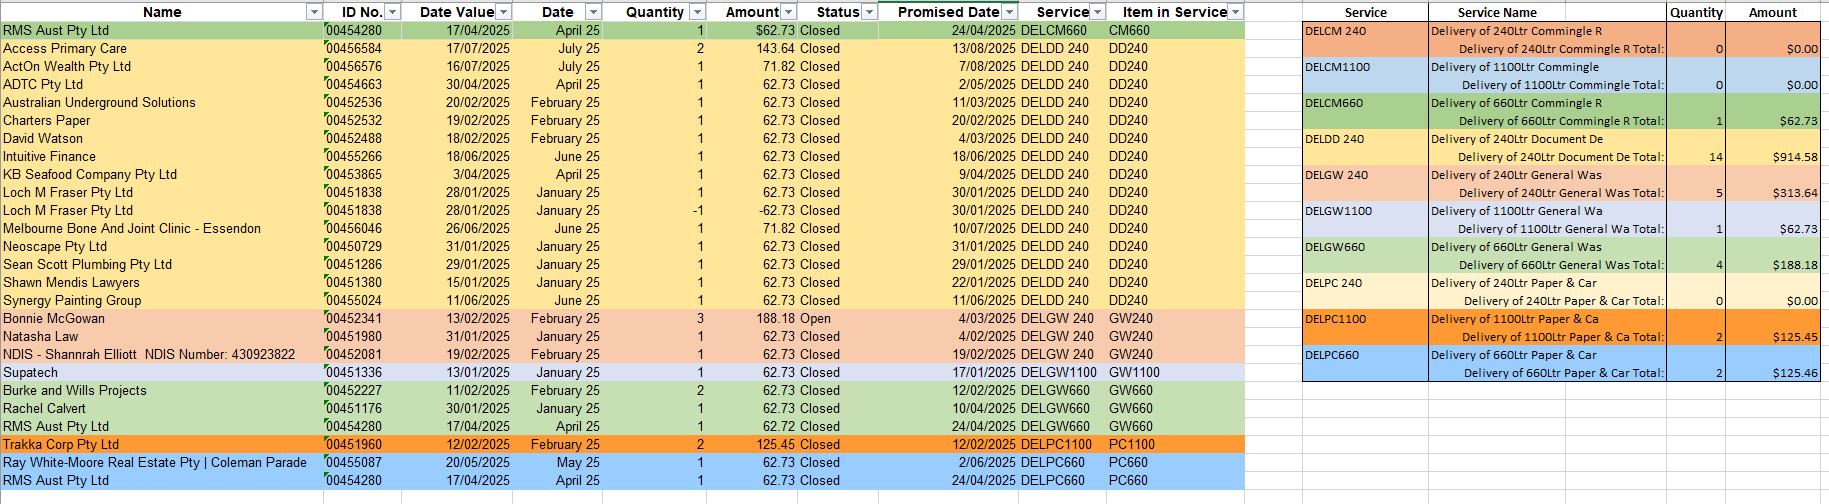
- I color coded each service for clarity so you can follow that or create your own. Also, the Date column has a code to simplify the date from the report into a simpler version.
- Time to create the Graphs and Tables.
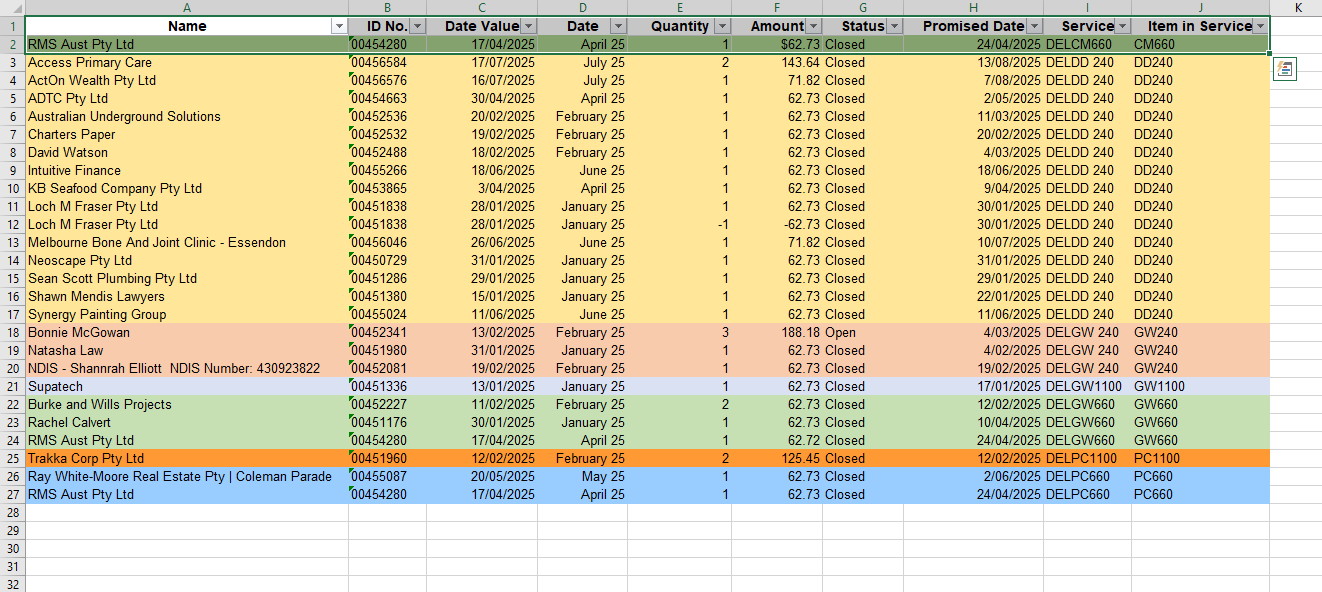
- Select a service and other items of that service. Don't forget to include the Header Tables.
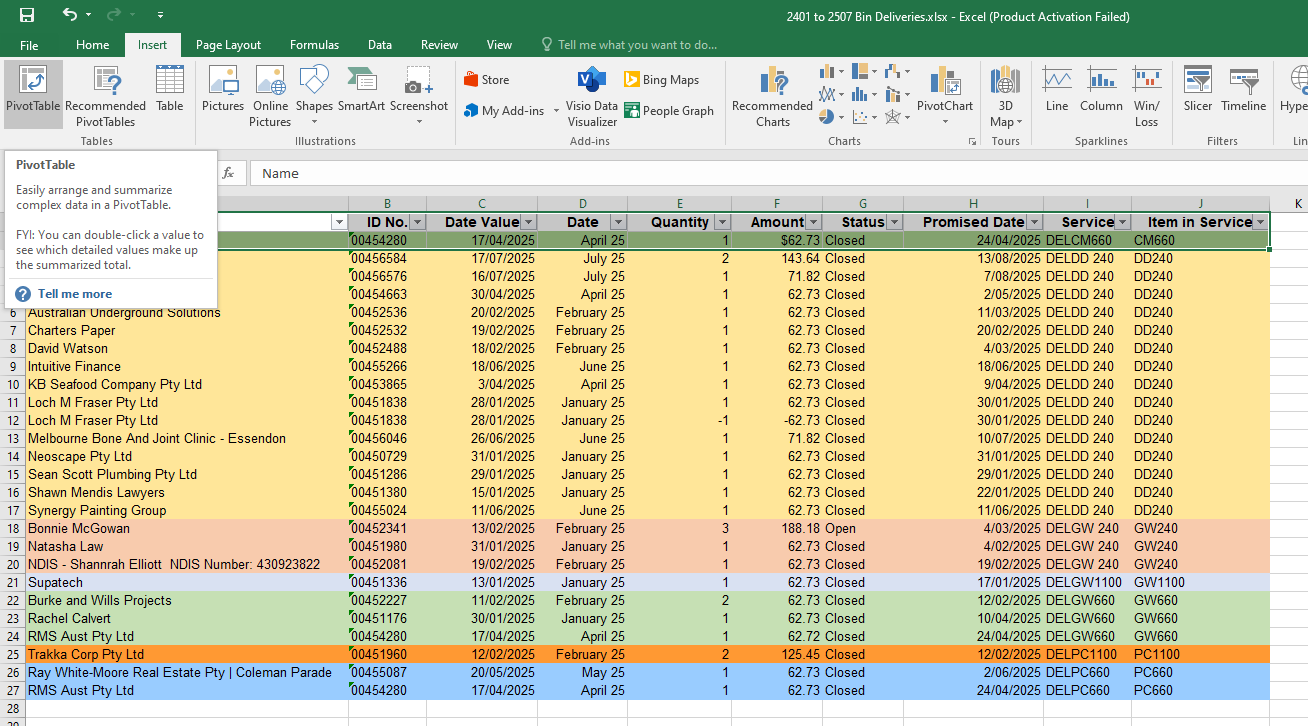
- Go to Insert tab and click Pivot Table.
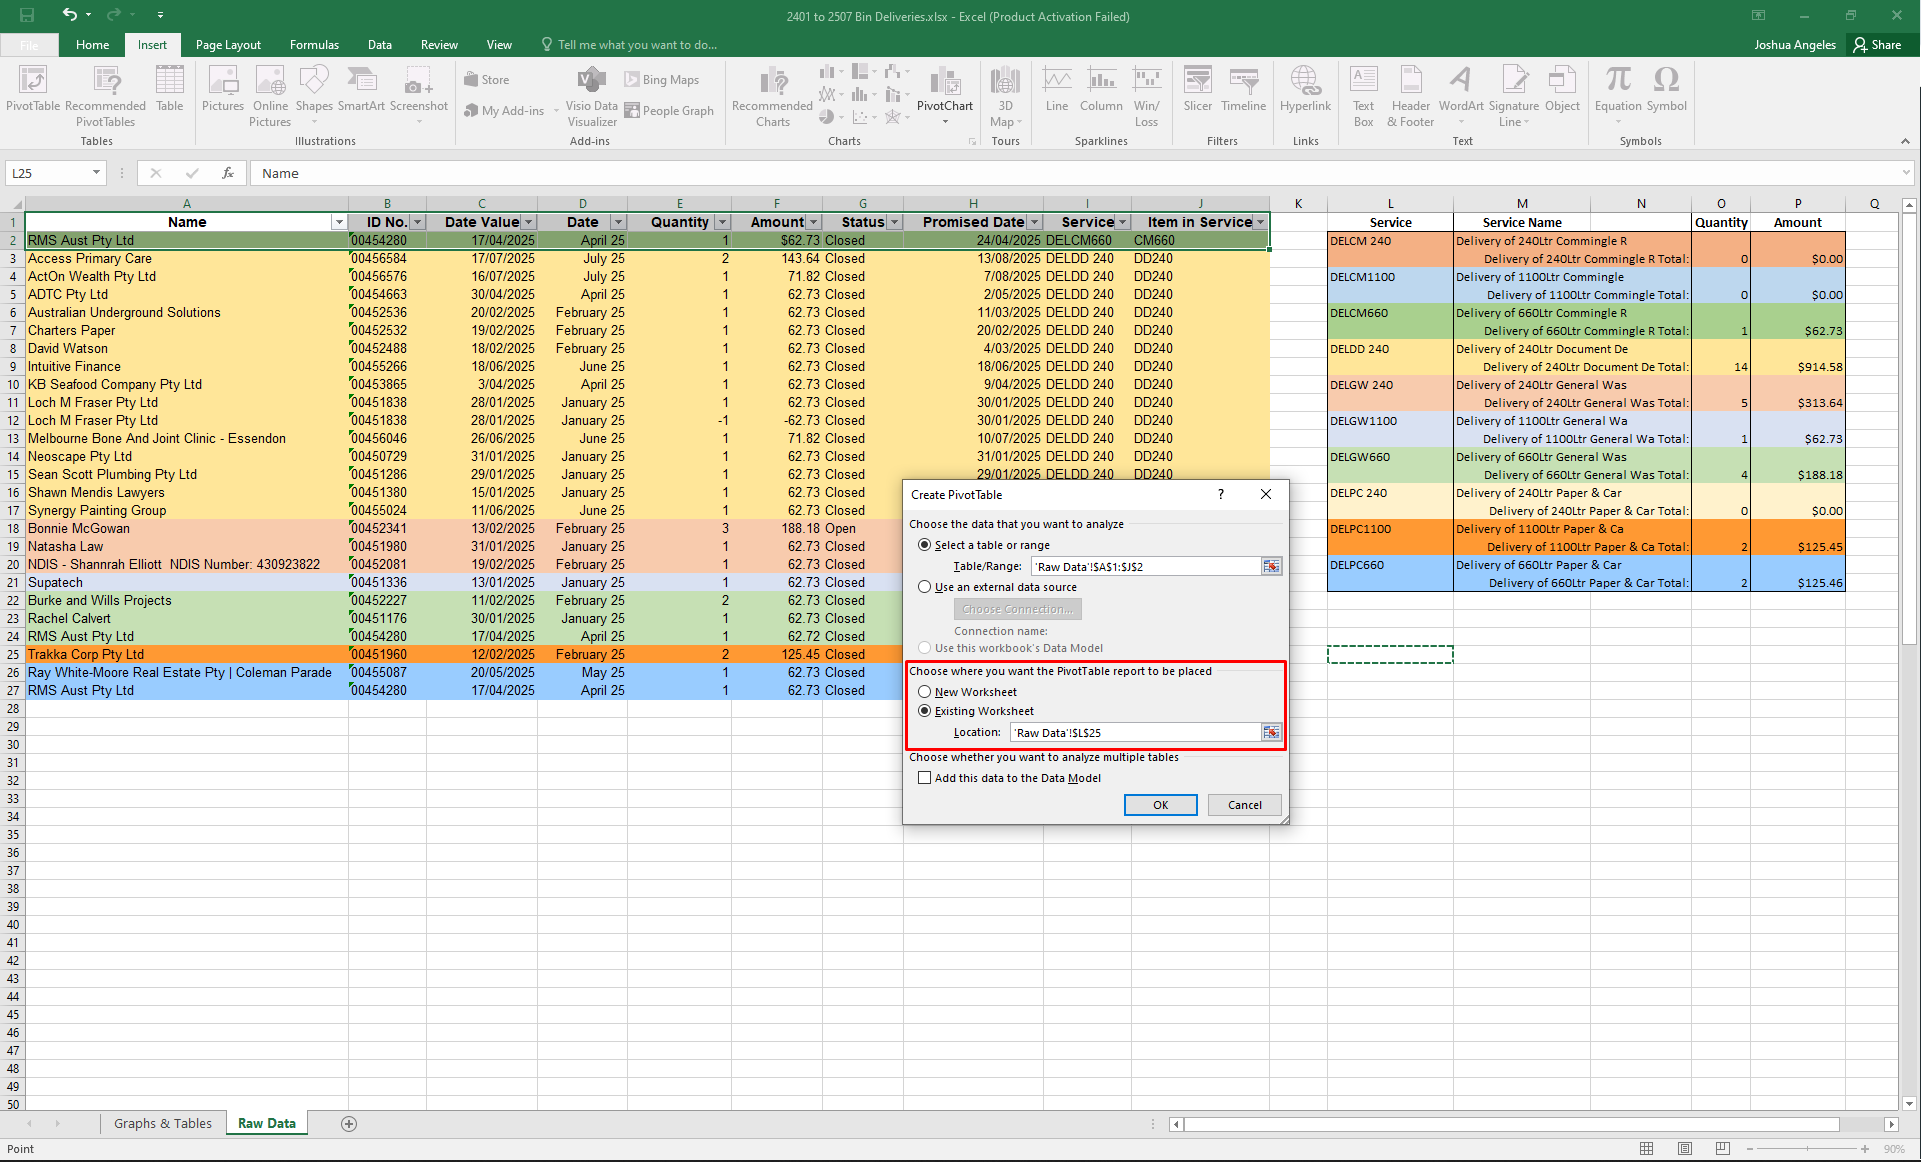
- A window will open to create a PivotTable. Select Existing Worksheet. Input the location where the table will be placed. You can use the the button near the input box to select the cell.
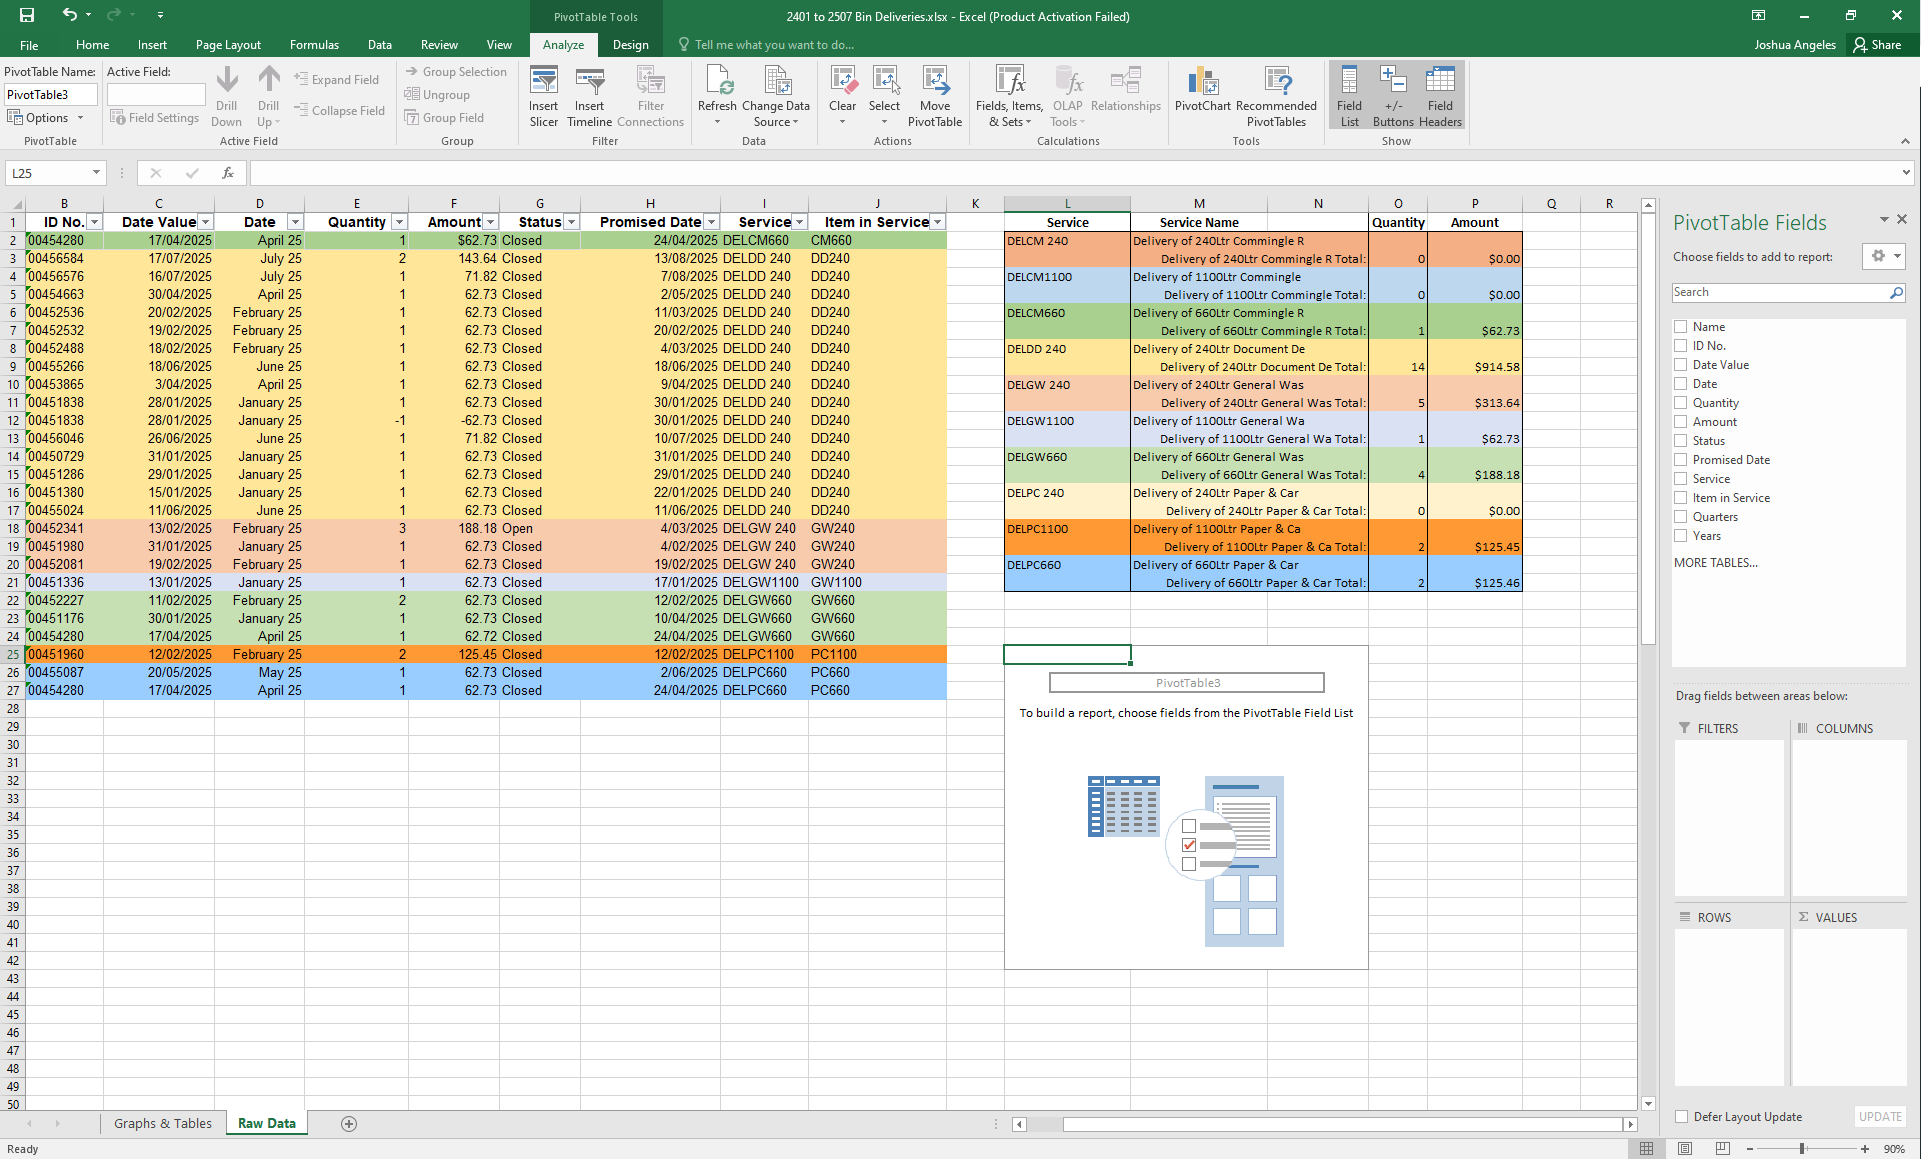
- On the right side, the PivotTable Fields. Check Date, Quantity, Item in Service, and Year/Month if available. Follow the format of the columns, rows, and values. Do the same for the other services.
I move the rows that have already been completed underneath to mark them as done while moving up the rest. Make sure to group the CM, DD, GW, and PC items.
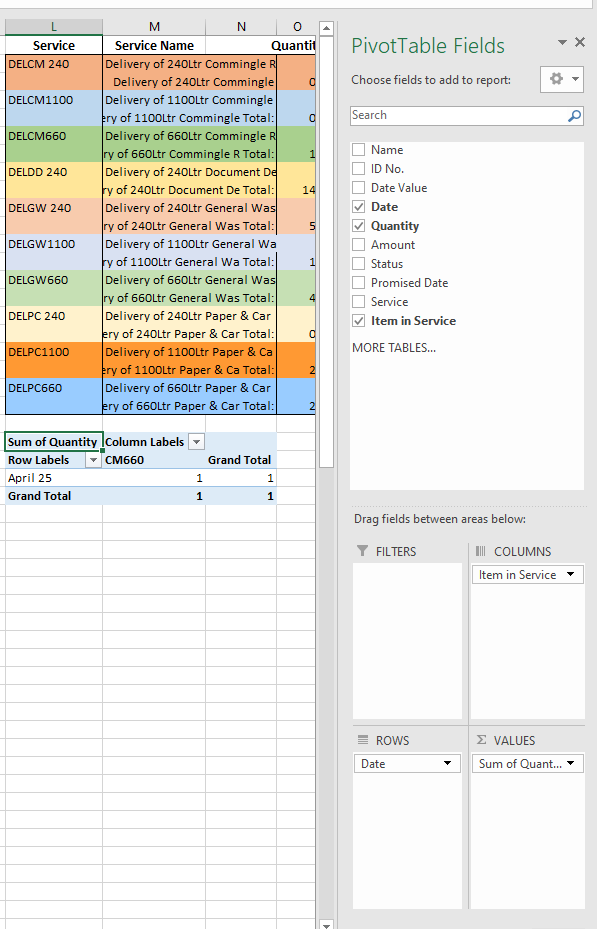
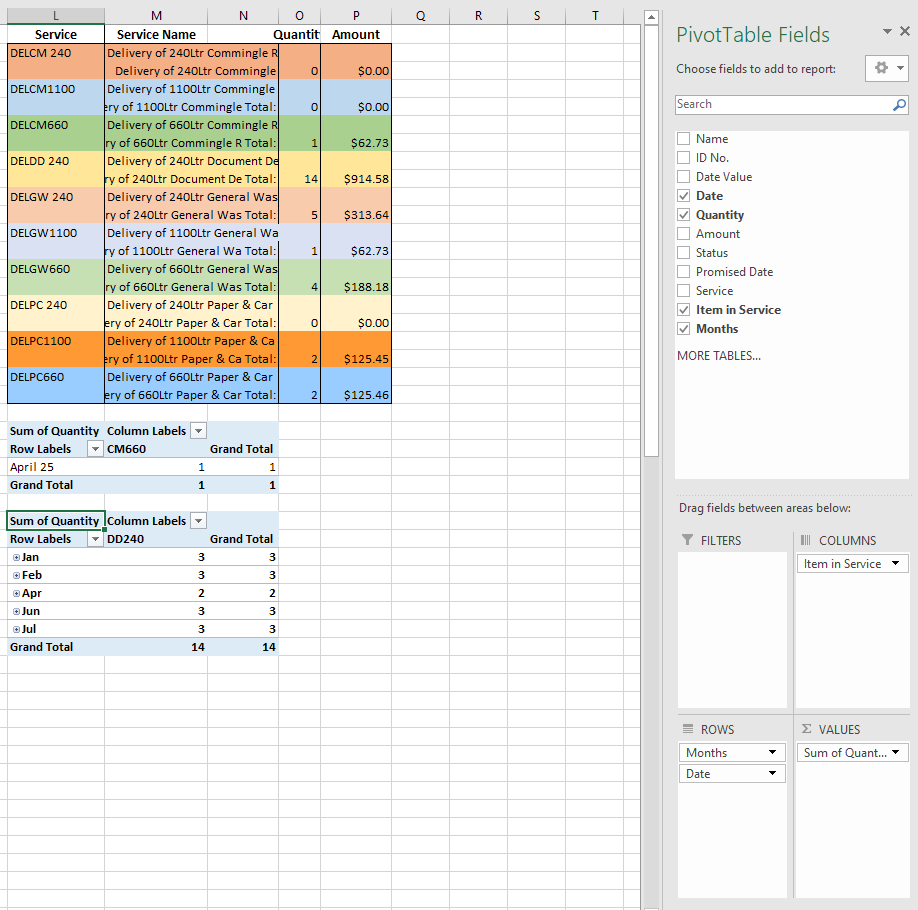
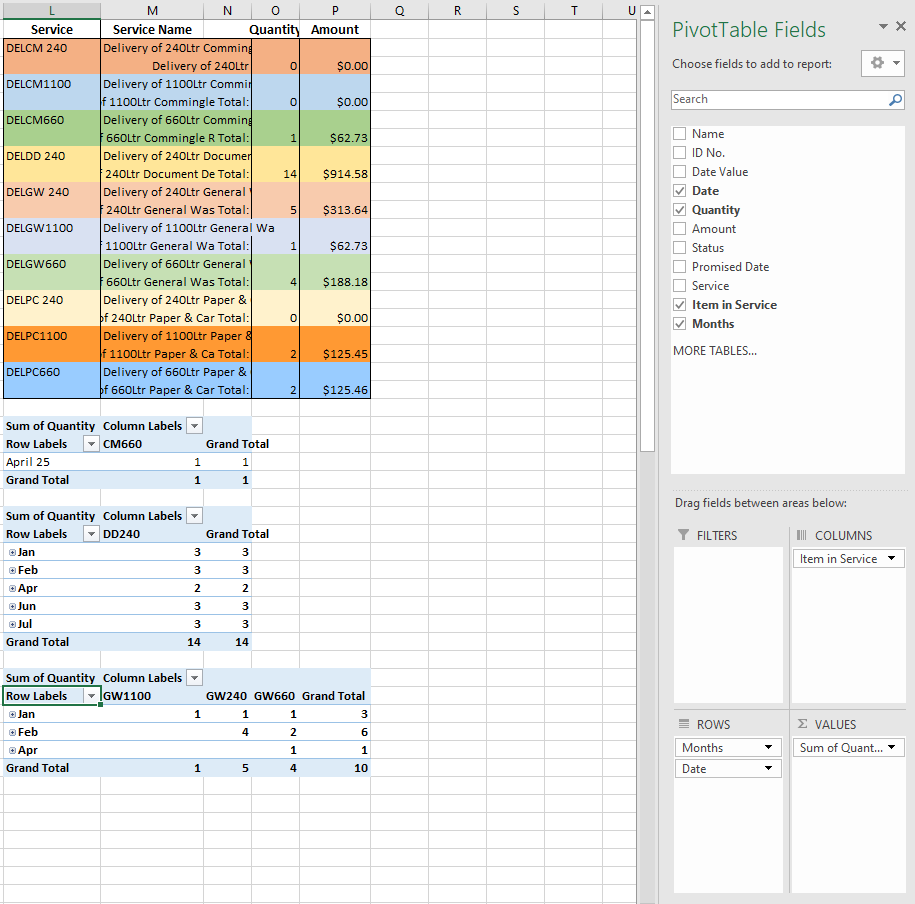
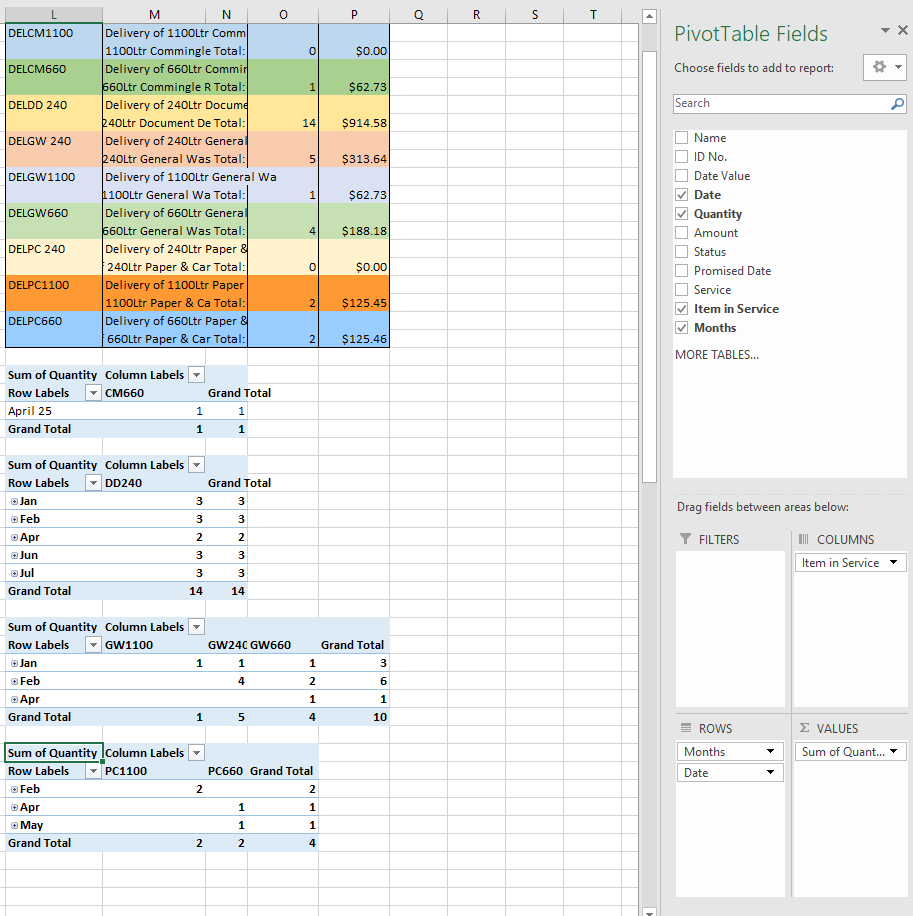
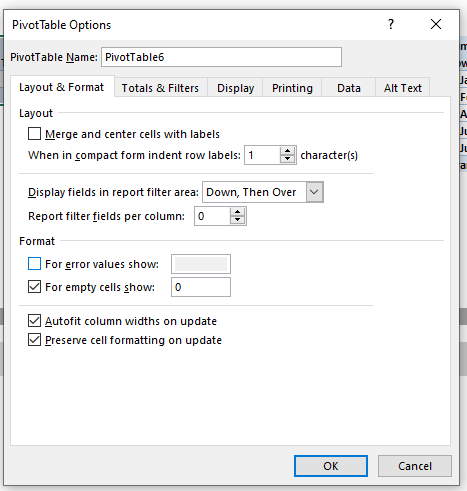
Note: To avoid blank spaces. Right Click a PivotTable, Select PivotTable Options. In Format, place a check on the checkbox for "For empty cells show:" then input "0" in the input box.
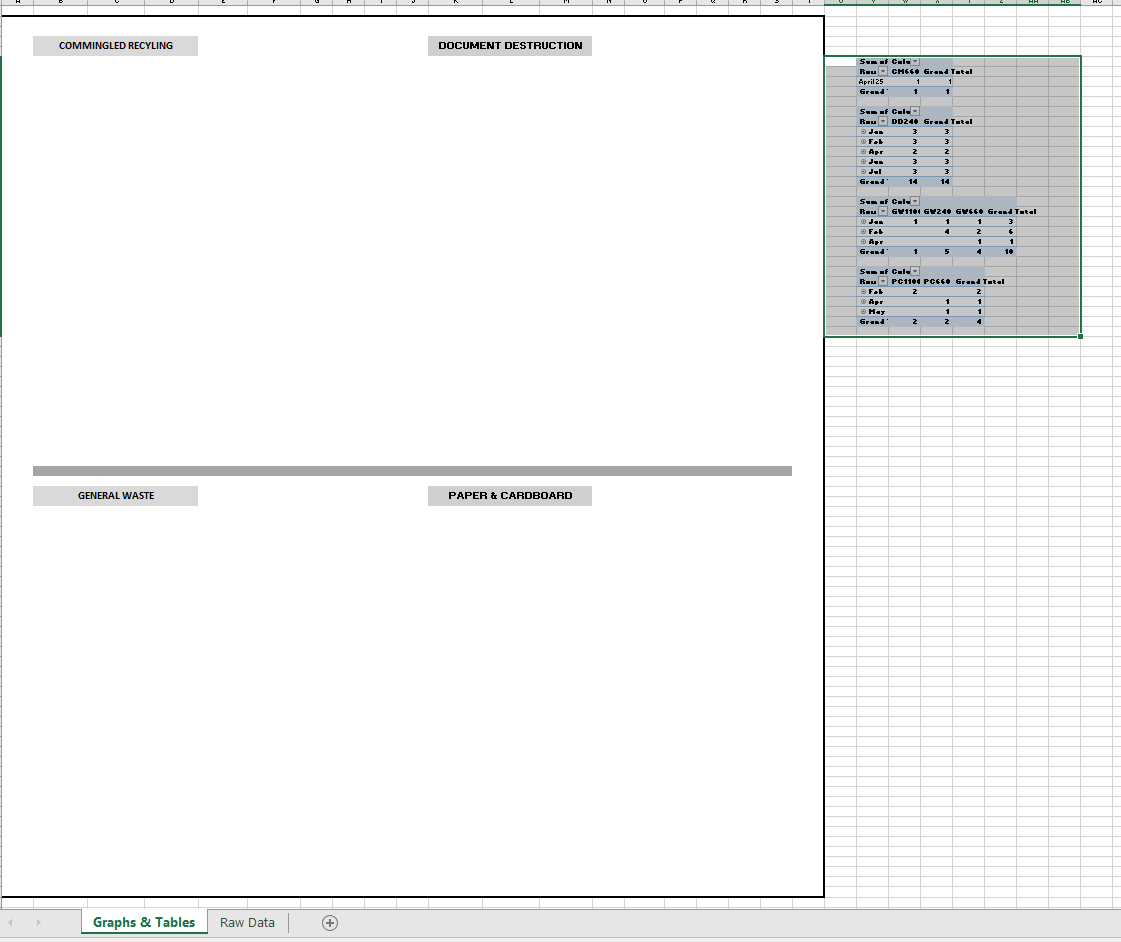
- Now you have the PivotTables. Cut and paste them to the Graphs & Tables worksheet. Move each table to their corresponding labels.
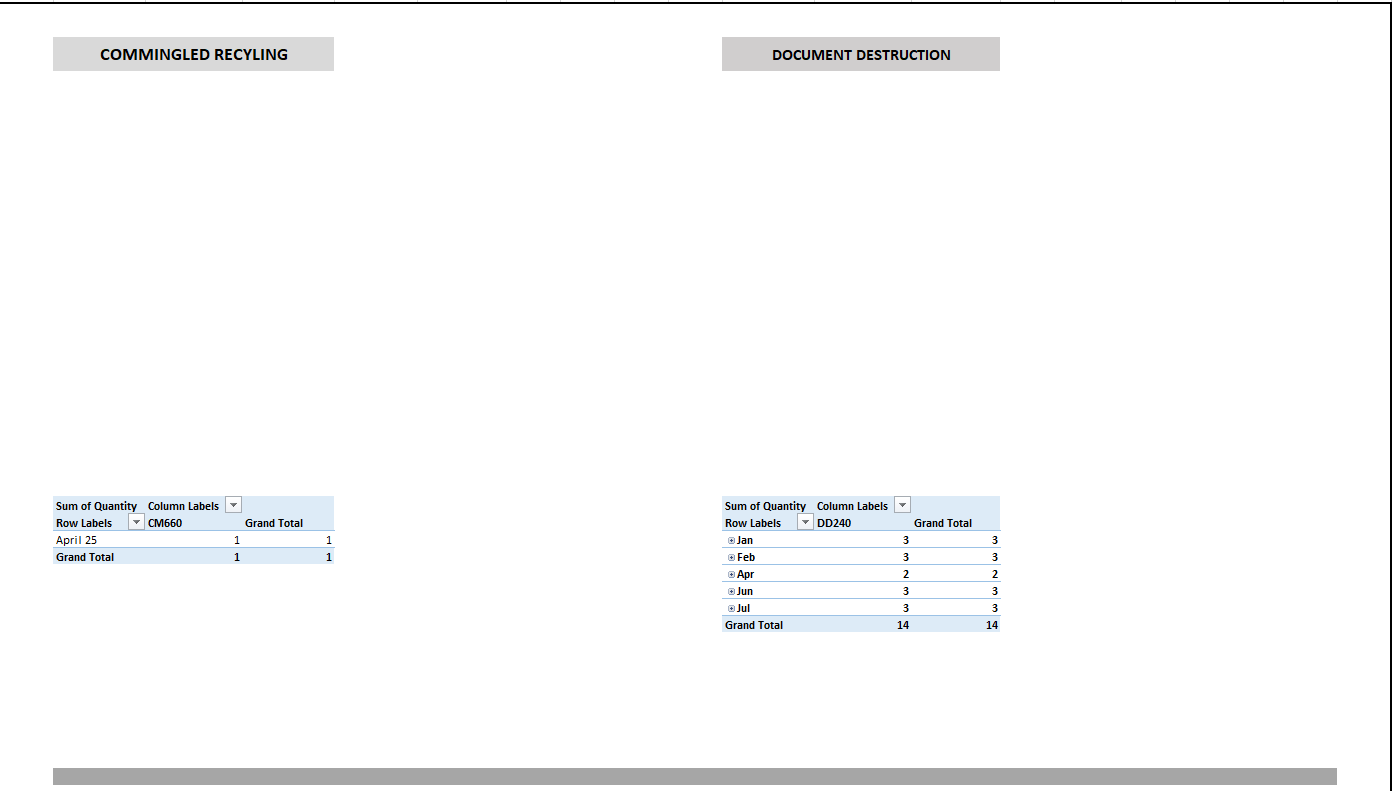
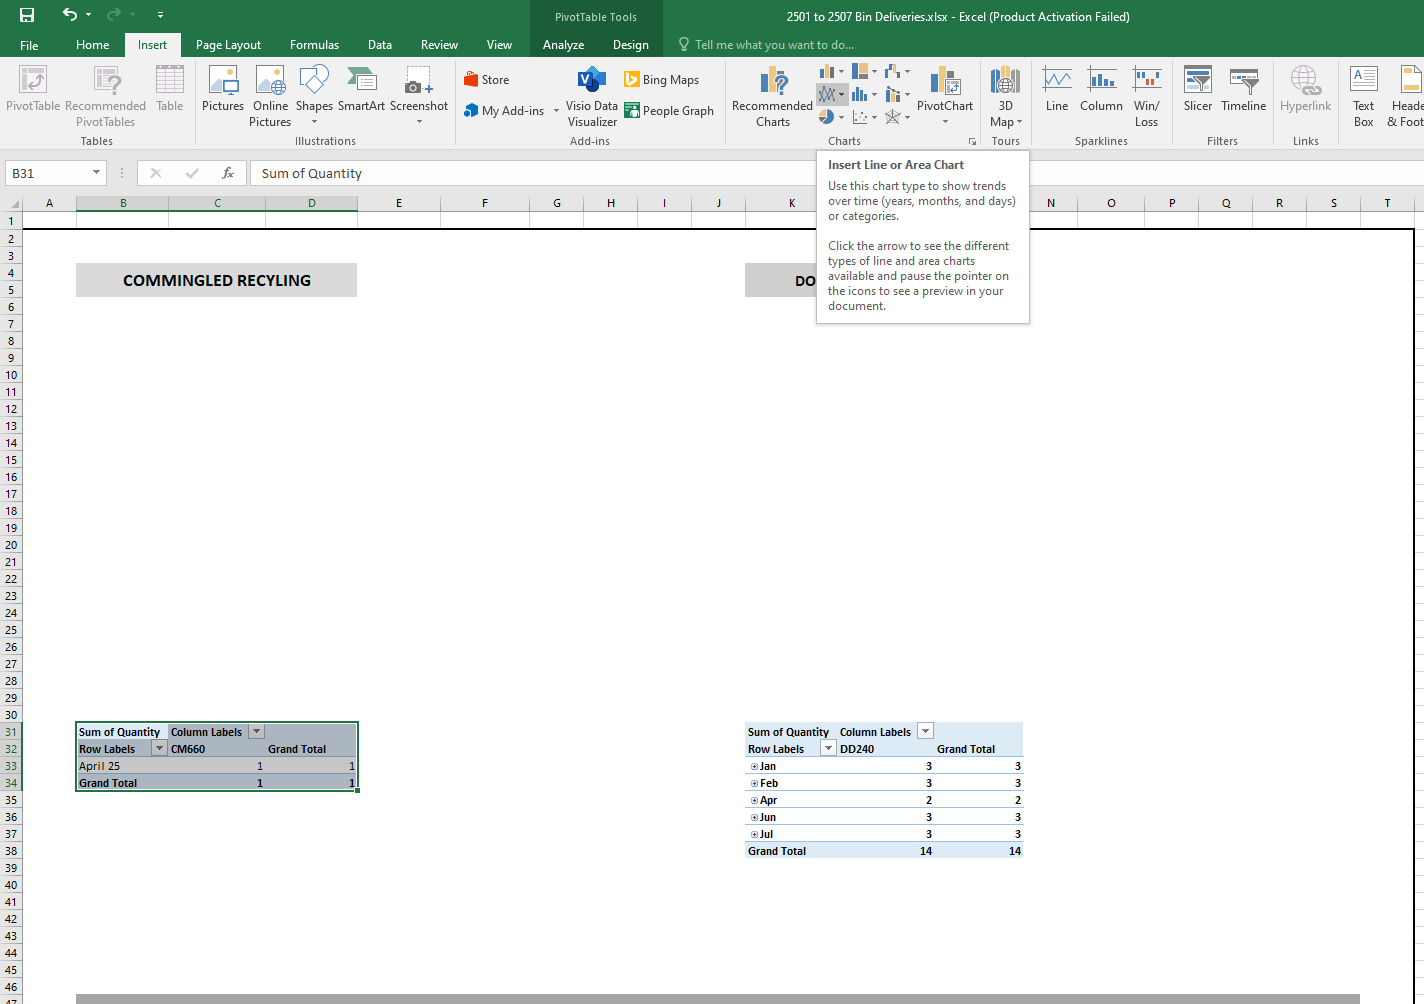
- Now click on a whole table. Go to Insert Tab and locate the Line Chart. Click the Line Chart. Locate and click the Line with Markers.
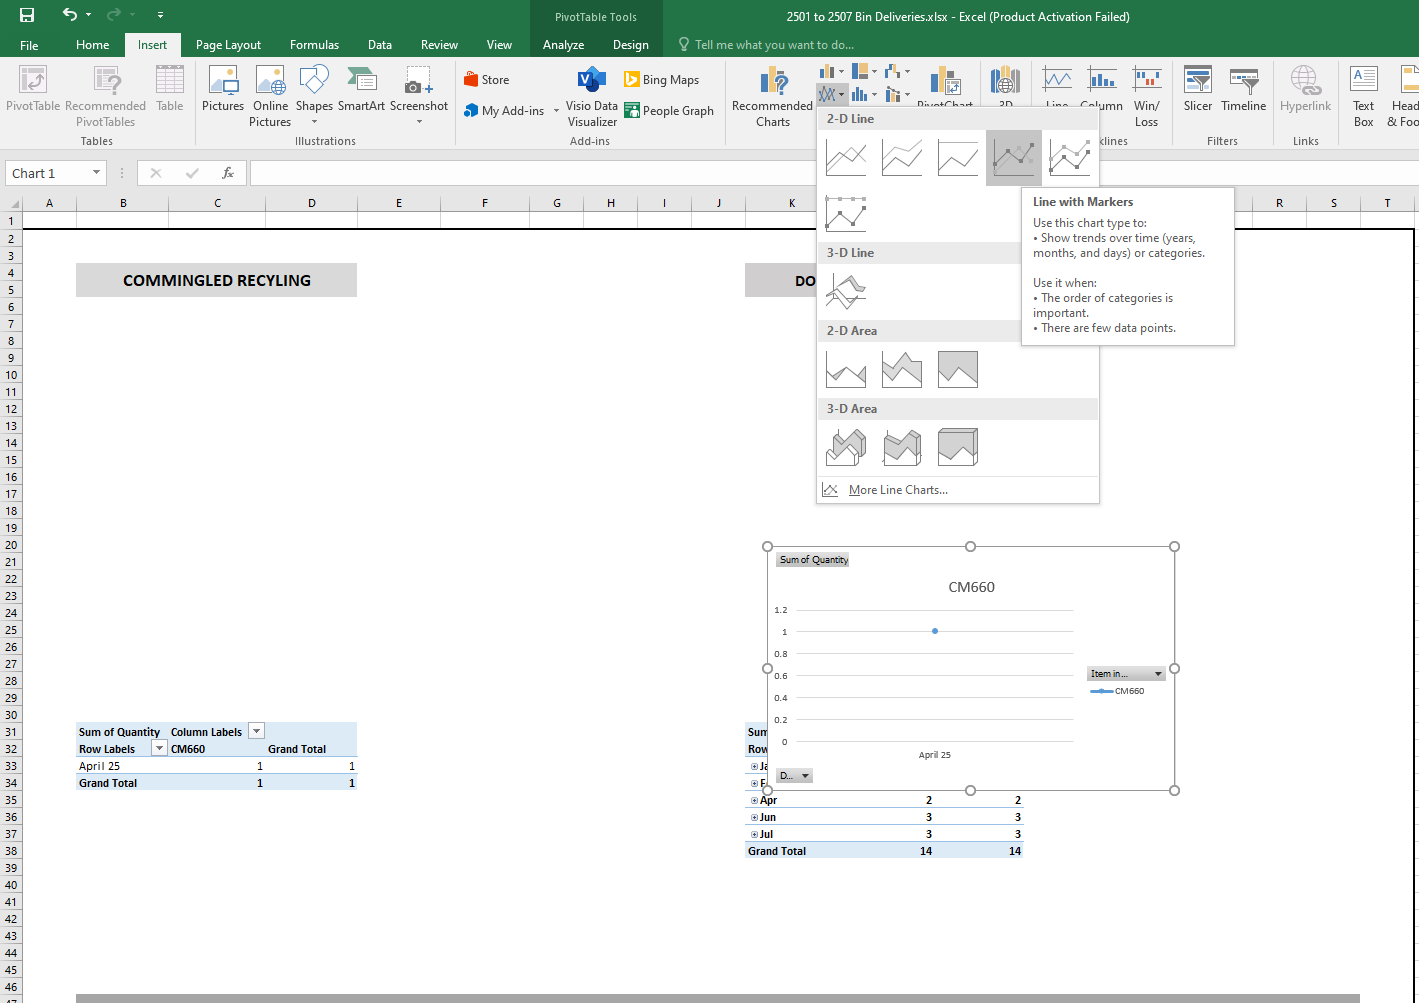
- Move and resize the chart and content to your specifications.
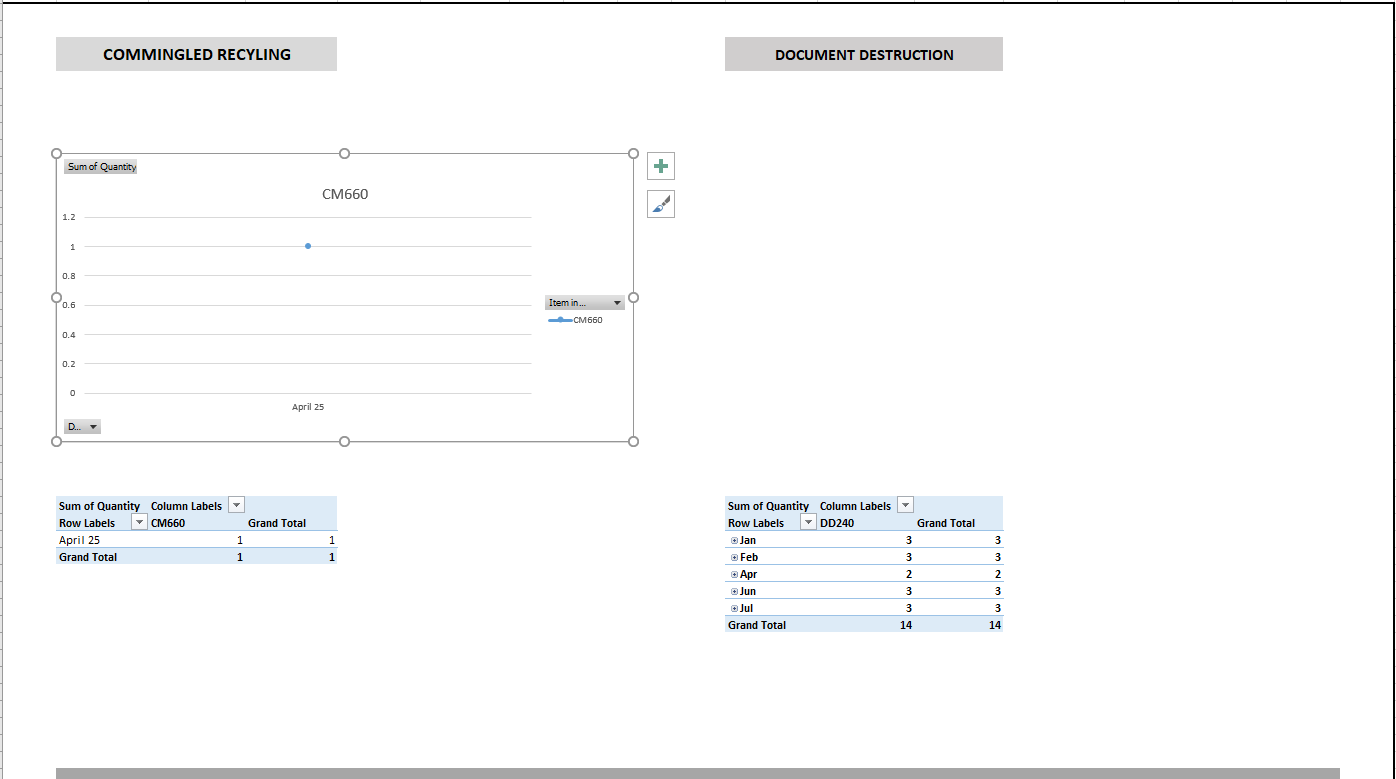
- Do the same with the other tables. Double check the contents.
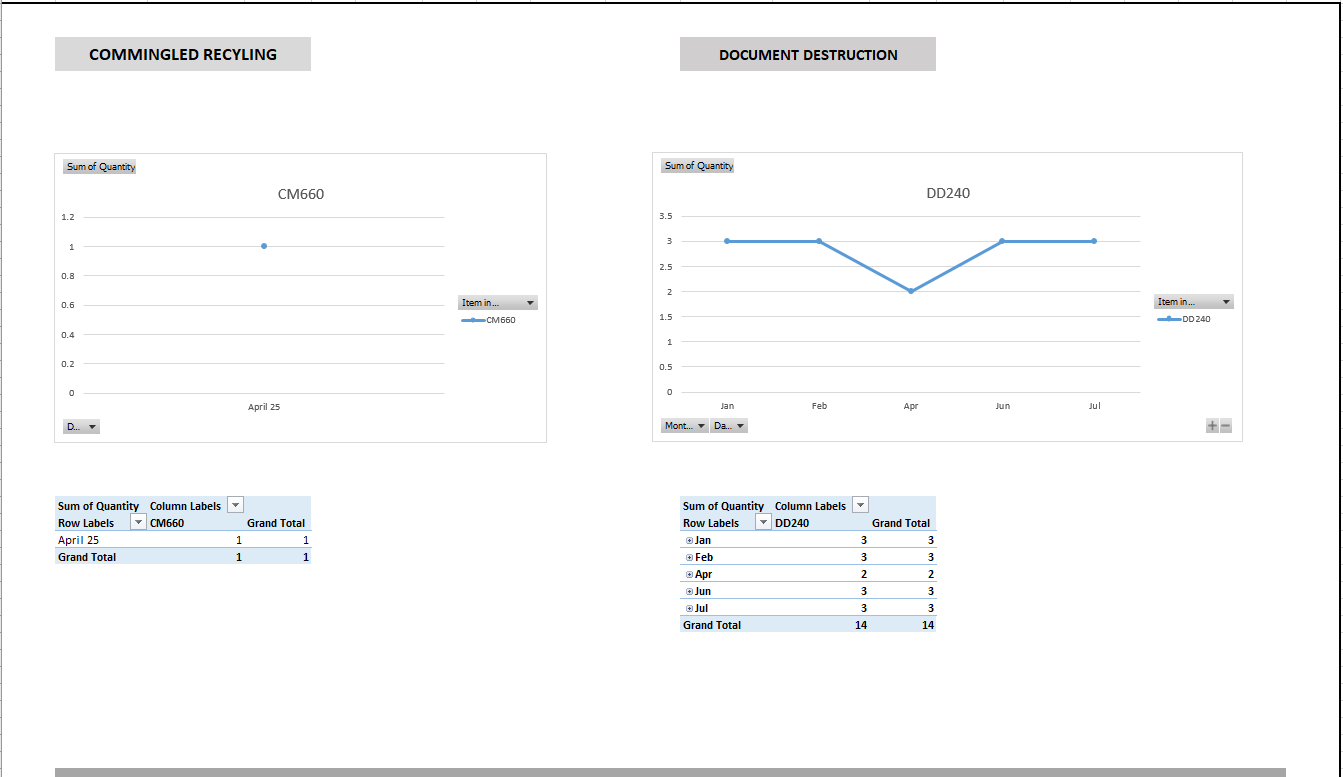
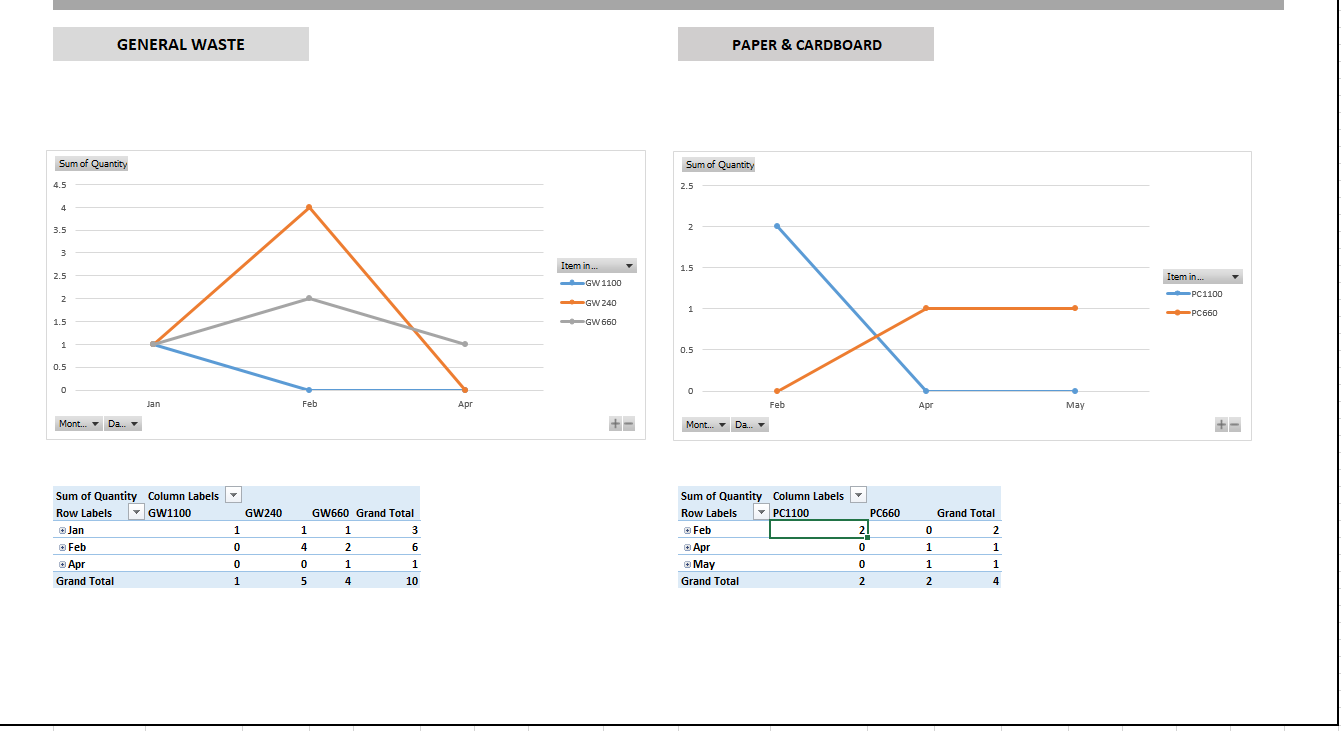
- Once you are done double checking, you are now done. Save it and make sure it is on the same directory, "Z:\Australian Waste Management\Current Year\Archiving\Accounts\Management Reports\Bin Deliveries" with the other files like it.
- Select a service and other items of that service. Don't forget to include the Header Tables.
- Bin Deliveries.xlsx is the sales report of the bin deliveries. Two (2) sheets: One for the Graphs and Tables, the other for the Raw Data we will be using.
- Find a copy of the .xlsx file of Bin Deliveries. "XXXX to XXXX Bin Deliveries.xlsx"
Comments